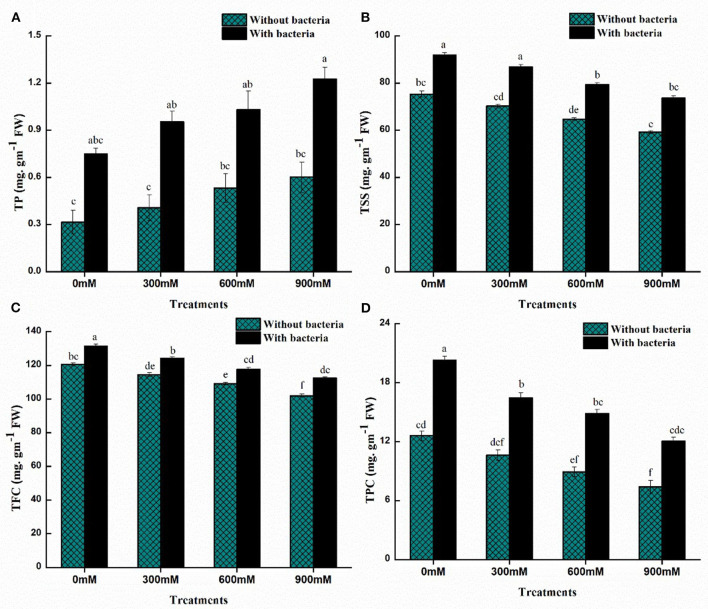
Figure 5.
Effects of Bacillus thuringiensis PM25 on (A) Total soluble sugars (B) Protein content (C) Flavonoid content (D) Phenolic content. Bars sharing different letter (s) for each parameter are significantly different from each other according to the LSD test (p ≤ 0.05). All the data represented are the average of three replications (n = 3). Error bars represent the standard errors (SE) of three replicates.

