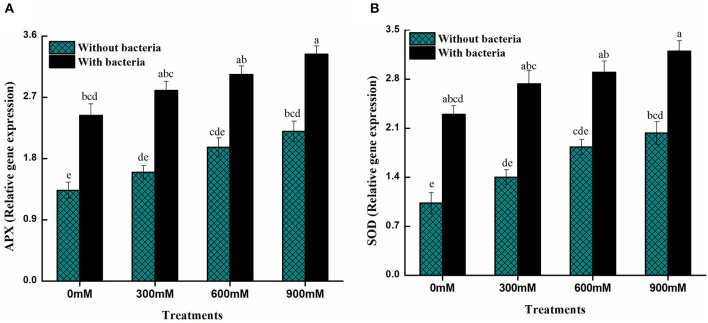
Figure 6.
Expression levels of antioxidant genes of maize in the absence and presence of B. thuringiensis PM25 under salinity stress (A) Ascorbate peroxidase (APX) (B) Superoxide dismutase (SOD). Bars sharing different letter (s) for each parameter are significantly different from each other according to the LSD test (p ≤ 0.05). All the data represented are the average of three replications (n = 3). Error bars represent the standard errors (SE) of three replicates.

