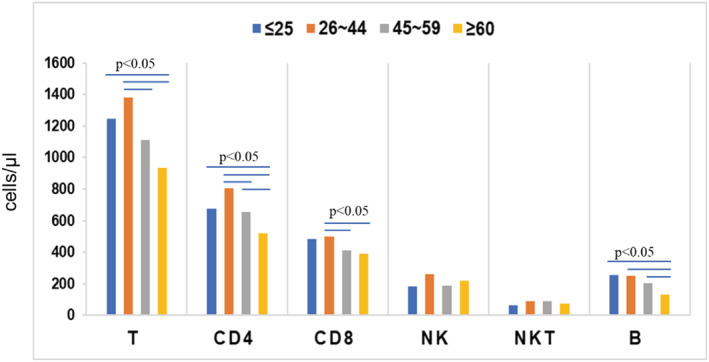
FIGURE 2.

Comparison of lymphocyte subset absolute counts among four age groups of patients with simple PTB. The blue bars indicate significant differences between groups (P < 0.05), the Y‐axis represents the mean values of the lymphocyte subset counts (cells/μl), and the X‐axis represents the lymphocyte subsets in the four age groups
