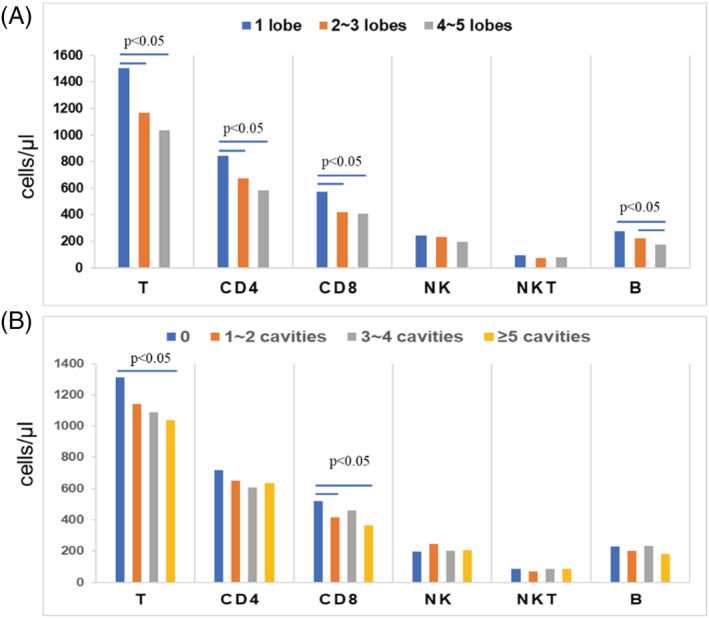
FIGURE 4.

Comparison of lymphocyte subset absolute counts between the different pulmonary lesion lobe groups (A) and the different pulmonary cavity groups (B) in patients with simple PTB. The blue bar marks the significant difference (P < 0.05), the Y‐axis represents the mean values (cells/μl) of the lymphocyte subsets, and the X‐axis represents the lymphocyte subset groups
