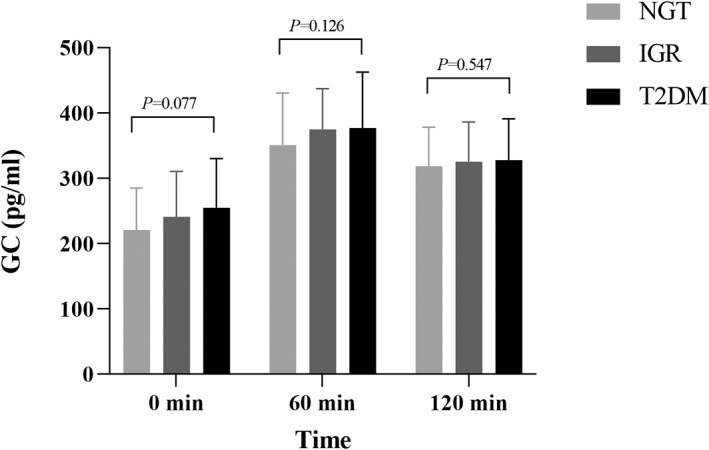
FIGURE 1.

Comparison of GC between different glucose tolerance groups. Multiple comparisons between groups showed that the GC level at each time point before and after OGTT was in the newly diagnosed T2DM group > IGR group > NGT group, and the difference between the groups was not significant (p > 0.05). GC, glucagon; IGR, impaired glucose regulation; NGT, normal glucose tolerance; OGTT, oral glucose tolerance test; T2DM, type 2 diabetes mellitus
