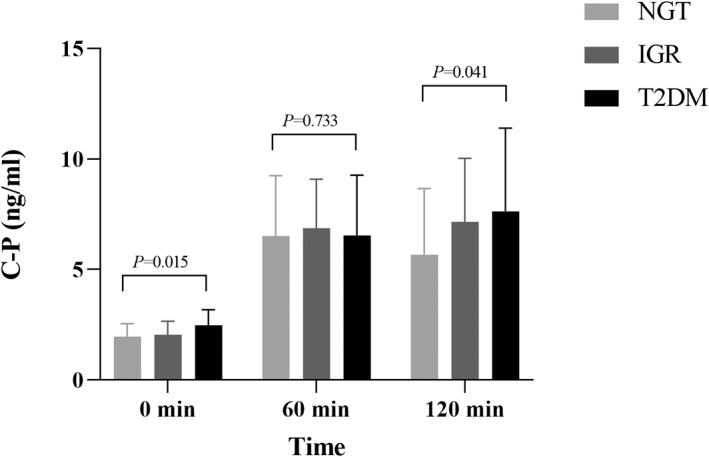
FIGURE 3.

Comparison of C‐P between different glucose tolerance groups. Multiple comparisons among groups showed that the fasting C‐P in the newly diagnosed T2DM group was significantly higher than that in the NGT group (0.52101 ng·h/mL, 95% CI 0.1554–0.8867, p = 0.006) and the IGR group (0.42595 ng·h/mL, 95% CI 0.0632– 0.7887, p = 0.022), but there was no significant difference between the IGR group and the NGT group (p > 0.05). At 60 min after OGTT, C‐P in the newly diagnosed T2DM group was lower than that in the NGT and IGR groups, but the difference was not significant (p > 0.05). At 120 min after OGTT, C‐P was in the newly diagnosed T2DM group > IGR group > NGT group, and the difference between the T2DM group and the NGT group was significant (1.954265 ng·h/mL, 95% CI 0.0869–3.8216, p = 0.0 41), but the difference between the T2DM and IGR groups and the IGR and NGT groups did not reach significance (p > 0.05). CI, confidence interval; C‐P, C‐peptide; IGR, impaired glucose regulation; NGT, normal glucose tolerance; OGTT, oral glucose tolerance test; T2DM, type 2 diabetes mellitus
