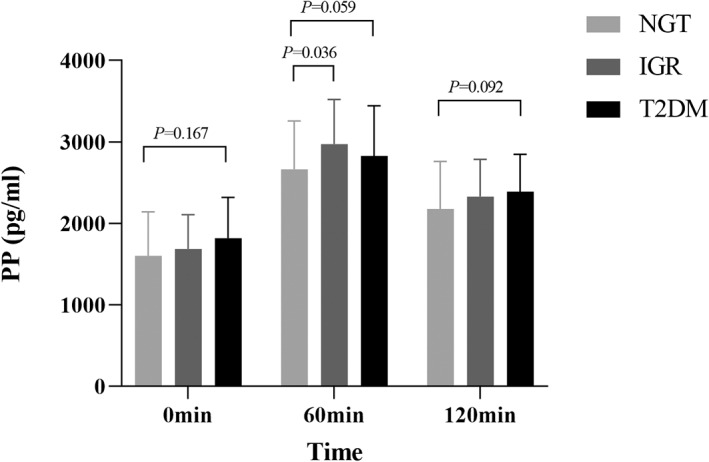
FIGURE 4.

Comparison of PP between different glucose tolerance groups. After the oral administration of 75 g glucose, the concentration of PP gradually increased and reached the peak of secretion 60 min after the administration of glucose, which was about 1.5 ~ 2 times of the basal level. After that, the level of PP gradually decreased and dropped to the basal level 120 min after the administration of glucose. Multiple comparison between groups showed that fasting PP was in the newly diagnosed T2DM group > IGR group > NGT group, and there was no significant difference between groups (p > 0.05); PP at 60 min after OGTT was in the IGR group > T2DM group > NGT group, and the difference between IGR group and NGT group was significant (310.24 pg·h/mL, 95% confidence interval 21.05–599.44, p = 0.036); PP at 120 min after OGTT was in the newly diagnosed T2DM group > IGR group > NGT group, and there was no significant difference between groups (p > 0.05). IGR, impaired glucose regulation; NGT, normal glucose tolerance; OGTT, oral glucose tolerance test; PP, pancreatic polypeptide; T2DM, type 2 diabetes mellitus
