Figure 1.

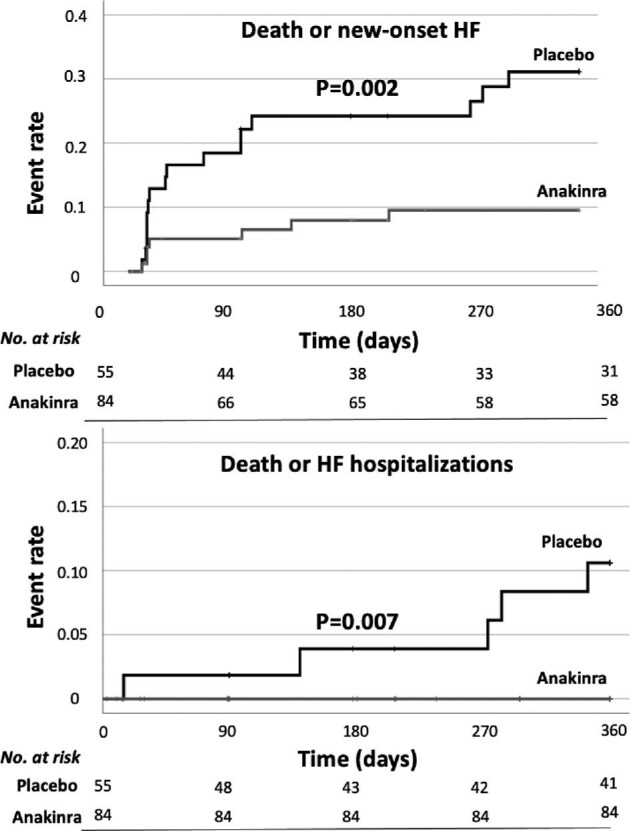
Kaplan–Meier curves for the incidence of the composite of all-cause death and new-onset heart failure and for the composite of all-cause death and heart failure hospitalizations, with a comparison between groups by log-rank test.

Kaplan–Meier curves for the incidence of the composite of all-cause death and new-onset heart failure and for the composite of all-cause death and heart failure hospitalizations, with a comparison between groups by log-rank test.