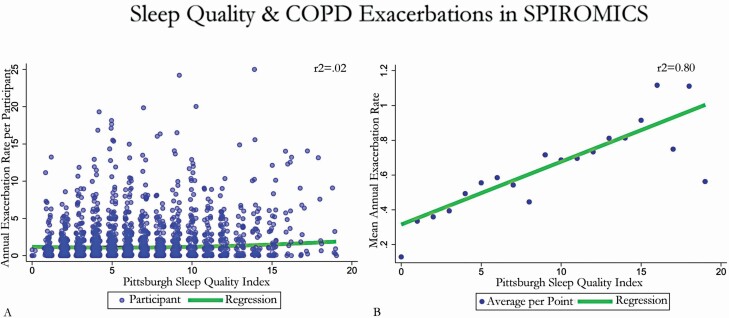
Figure 2.
Association between Pittsburgh Sleep Quality Index (PSQI) score and total and mean annualized exacerbations in the unadjusted analysis. Scatter plot of exacerbations during study participation versus baseline PSQI score. (A) Demonstrates total annualized exacerbations, while (B) displays mean per 1-point PSQI score. A linear regression of the trend of B and zero-inflated negative binomial regression of A is super-imposed.

