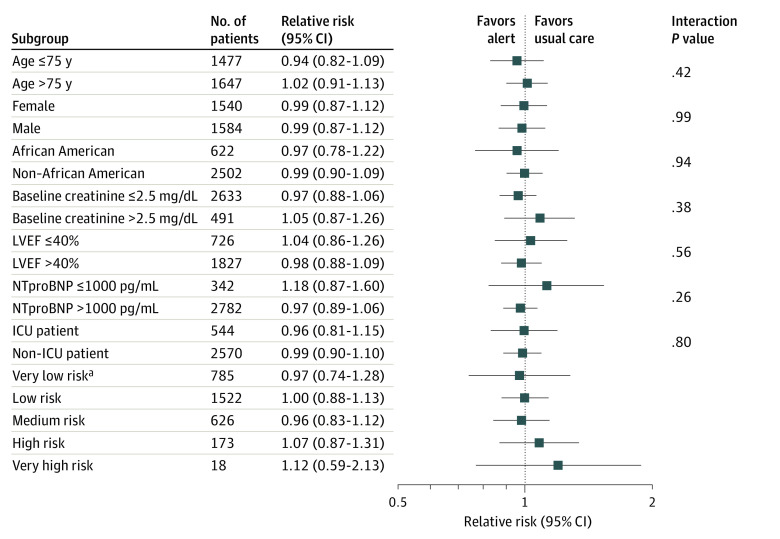
Figure 3. Primary Outcome According to Prespecified Subgroups.
Prespecified subgroup analyses showed that none of the baseline characteristics of the patients including age (≤75 y vs >75 y), sex, race, baseline creatinine level (≤2.5 mg/dL vs >2.5 mg/dL), left ventricular ejection fraction (LVEF; ≤40% vs >40%), N-terminal pro–brain natriuretic peptide level (NT-proBNP; ≤1000 pg/mL vs >1000 pg/mL), admission to the intensive care unit (ICU), or predicted risk category identified characteristics in which knowledge of risk might lead to improved outcomes.
SI conversion factor: To convert creatinine to micromoles per liter, multiply by 88.4; to convert NT-proBNP to nanograms per liter, multiply by 1.
aComparisons of relative risk (95% CI) between risk groups: very low risk (VLR) vs LR, 0.98; 95% CI, 0.74-1.28 vs 1.00; 95% CI, 0.88-1.13; P = .94; VLR vs medium risk (MR), 0.98; 95% CI, 0.74-1.28 vs 0.96; 95% CI, 0.83-1.12; P = .93; VLR vs high risk (HR), 0.98; 95% CI, 0.74-1.28 vs 95% CI, 1.07; 95% 0.87-1.31; P = .53; VLR vs VHR, 0.98; 95% CI, 0.74-1.28 vs 1.12; 95% CI, 0.59-2.13; P = .48.

