. 2022 Jul 29;11:e76319. doi: 10.7554/eLife.76319

Figure 3. Natural killer-derived extracellular vesicles (NK-EVs) promote Th1 differentiation via Gata3 downmodulation and T-bet de-repression correlating with increased levels of miR-10b-5p and miR-92a-3p.

CD4+ T cells isolated from healthy human buffy coats were cultured either in non-polarizing or in cytokine Th1-polarizing conditions, with a mixture of IL-2 and IL-12, in the presence or absence of NK-EVs. (A) Flow cytometry analysis of isolated CD4+ T lymphocytes incubated under non-cytokine polarizing (upper panels) and Th1 cytokine-polarizing (with a mixture of IL-2 and IL-12, lower panels) conditions. A representative experiment is shown. Box and whiskers plots show the expression of CD4 and IFN-γ in gated live cells (min to max and median values), after addition of NK-EVs(Right panel). Plots show the quantification of n≥4 independent experiments. Significance was assessed with paired Student’s t-test; *p<0.05, **p<0.01. (B) ELISA quantification of soluble IFN-γ in supernatants from cultured cells in the indicated conditions (unpolarized, upper panel; cytokine polarized, lower panel). The chart shows the median concentration from n≥4 independent experiments. Significance was assessed with paired Student’s t-test; *p<0.05. (C) Flow cytometry analysis of isolated CD4+ T cells cultured in the different conditions. Graphs show the mean fluorescence intensity of T-BET in gated live single CD4+ T cells after 3 and 6 days of culture, respectively. Significance was assessed with paired Student’s t-test; *p<0.05. (D,E) Quantitative real-time PCR at days 3 and 6 showing mRNA levels of TBX21 (D) and GATA3 (E), respectively, normalized to GAPDH and ACTB. Significance was assessed by paired Student’s t test; *p<0.05. (F) Quantitative real-time PCR at day 3 to detect microRNA (miRNA) levels in CD4+ T cells after culture in the indicated conditions. MiR-10b-5p (left panel) and miR-92a-3p (right panel) relative expression is shown, and normalized to RNU1A1 and RNU5G. Significance was assessed by paired Student’s t test; *p<0.05.

Figure 3.

Figure 3—figure supplement 1. Natural killer-derived extracellular vesicle (NK-EV) microRNAs (miRNAs) and T cell function.

Figure 3—figure supplement 1.

(A) Cytokine profiler of CD4+ T lymphocytes incubated for 16 hr with NK-EVs. Data show the relative expression of the indicated cytokines and chemokines, expressed in arbitrary units (a.u.). (B) Flow cytometry analysis showing the viability of isolated CD4+ T cells incubated under non-cytokine-polarizing (upper panel) and Th1 cytokine-polarizing (with a mixture of IL-2 and IL-12, lower panel) conditions. Contour plots show a representative staining with the viability marker DAPI and expression of the apoptotic marker Annexin-V in CD4+ T cells. Plots show the quantification of live DAPI- Annexin-V- CD4+ T cells ± SEM, in the different culture conditions and after addition of NK-EVs. Plots show the quantification of n≥4 independent experiments. Significance was assessed with paired Student’s t-test. (C) Quantification of Annexin-V Geometric Mean Fluorescence Intensity. Data shown are from n≥4 independent experiments. Significance was assessed with paired Student’s t-test; *p<0.05. (D) Flow cytometry analysis of isolated CD4+ T cells incubated under non-cytokine-polarizing (upper panel) and Th1 cytokine-polarizing (with a mixture of IL-2 and IL-12, lower panel) conditions. Box and whiskers plots show the expression of T-bet and IFN-γ in gated live cells ± SEM, after addition of NK-EVs. Plots show the quantification of n≥4 independent experiments. Significance was assessed with paired Student’s t-test; *p<0.05, **p<0.01. (E) Flow cytometry analysis of CD4+ isolated cells 3 and 6 days after NK-EV incubation. Box and whiskers plots show the relative expression of T-BET (left) and GATA3 (right) proteins, normalized to PBS-treated cells (quantification of n≥4 independent experiments). Significance was assessed with paired Student’s t-test; *p<0.05. (F) CD4+ T cells were incubated with nanoparticles containing the NK-EV microRNAs (miRNAs) miR-10b and miR-92a and control nanoparticles for 72 hr. Thereafter cells were lysed and resolved in 10% SDS-PAGE and probed with the appropriate antibodies for T-BET, GATA3, and p150 protein detection, as indicated. Quantification of expression normalized to the p150 house-keeping marker is shown (lower panel).
Figure 3—figure supplement 1—source data 1. Uncropped Western blots from the figure.
Figure 3—figure supplement 1—source data 2. Original Western blot image showing p150 expression.
Figure 3—figure supplement 1—source data 3. Original Western blot image showing T-BET expression.
Figure 3—figure supplement 1—source data 4. Original Western blot image showing GATA3 expression.
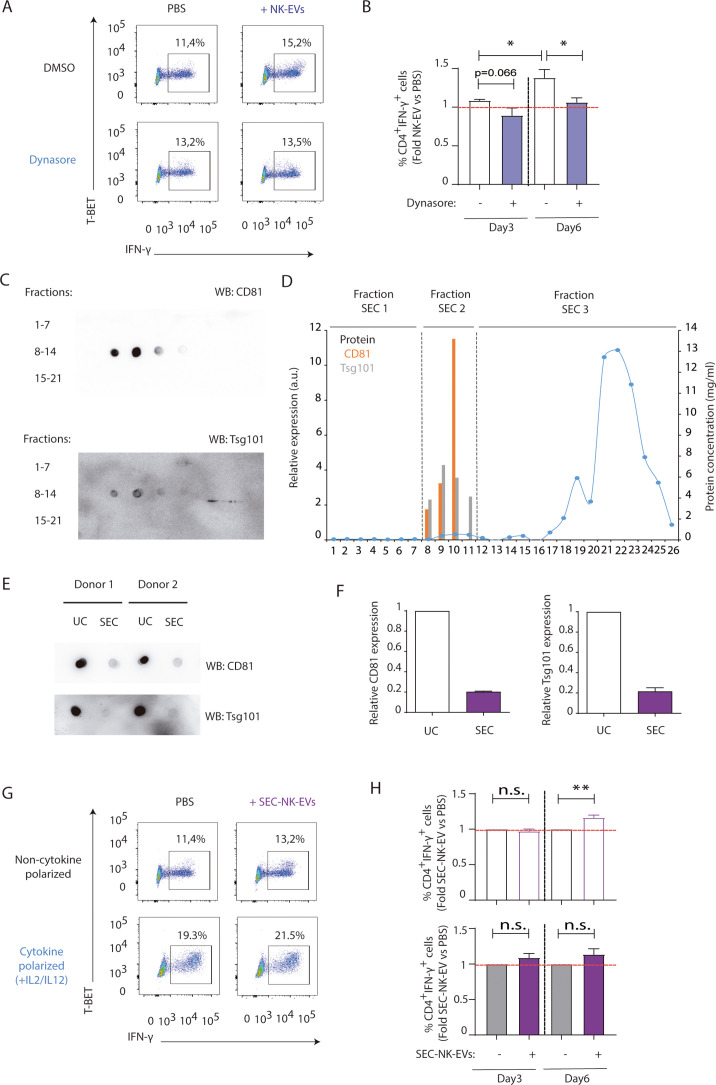
Figure 3—figure supplement 2. Extracellular vesicle (EV) uptake blockade using Dynasore and size-exclusion chromatography (SEC) analyses confirm the specificity of natural killer-derived EV (NK-EV) microRNAs (miRNAs) effects.

Figure 3—figure supplement 2.

(A,B) Isolated CD4+ T cells were incubated with 80 µM of Dynasore prior to functional analyses. (A) Flow cytometry analysis showing T-BET and IFN-γ. A representative experiment is shown. (B) Bar charts plots show the quantification of T-BET and IFN-γ expression in gated live cells (i to anmedian values), normalizing NK-EV (obtained by ultracentrifugation, as previously described) to PBS-treated cells. Panel shows the quantification of n≥4 independent experiments. Significance was assessed with paired Student’s t-test; *p<0.05. (C–F) NK-EVs from activated NK cells were isolated by SEC. (C) Dot blot analyses of recovered fractions show the expression of the small EV markers CD81 and Tsg101 in fractions 8–11. (D) Quantification of the different fractions relative expression of CD81 and Tsg101, assessed by ImageJ software analysis of dot-plots, and protein concentration measured by Nanodrop. SEC fractions 8–11 (SEC2) were pooled and ultracentrifuged at 100,000× g functional analyses. (E). Dot blots of small EVs obtained by either ultracentrifugation or SEC were probed against the small EV markers Tsg101 and CD81. (F) Quantification of dot blots from (E). (G,H) Isolated CD4+ T cells were incubated with SEC-isolated NK-EVs. (G) Flow cytometry analysis showing T-BET and IFN-γ representative experiment is shown. (H) Bar charts show the quantification of T-BET and IFN-γ expression in gated live cells CD4+ T cells, normalizing NK-EV (obtained by SEC) to PBS-treated cells. Panel shows the quantification of n≥4 independent experiments. Significance was assessed with paired Student’s t-test; **p<0.01.
Figure 3—figure supplement 3. HEK and Raji-derived small extracellular vesicles (EVs) exhibit a distinct effect on T cell function than natural killer-derived EVs (NK-EVs).

Figure 3—figure supplement 3.

Small EVs were isolated by differential ultracentrifugation from Raji and HEK human cell lines and their effects on isolated CD4+ T cells were analysed. (A) Flow cytometry analyses showing T-BET and IFN-γ expression in CD4+ T cells treated with either PBS, HEK-EVs, or Raji-EVs, as indicated, either in the presence or absence of Th1-polarizing cytokines. A representative experiment is shown. (B) Charts show the quantification of the percentage of CD4+ IFN-γ T cells in the different conditions from four independent experiments. Significance was assessed with paired Student’s t-test; ***p<0.001.