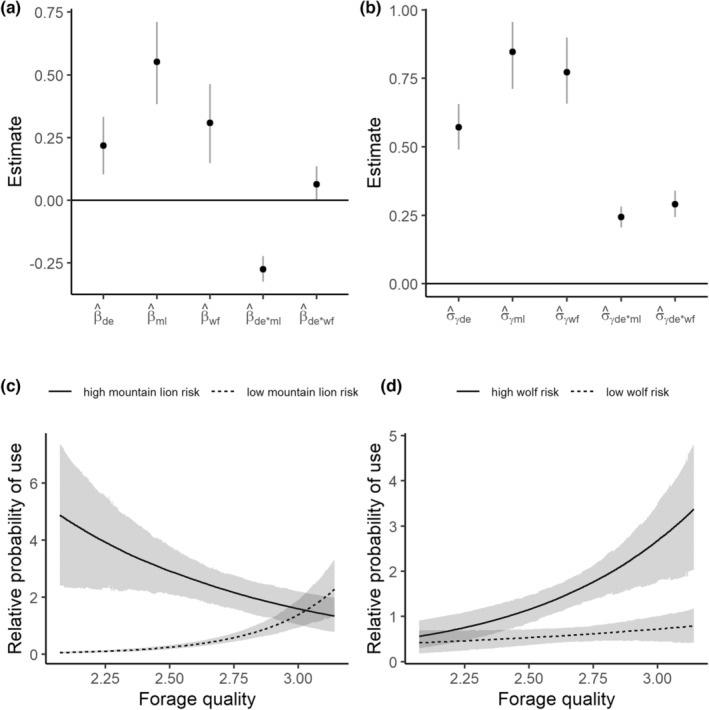
FIGURE 3.

Results of the second‐order elk summer resource selection model and predicted relationships between forage quality, predation risk and resource selection. The top panels illustrate the coefficient estimates (on the log scale) for the fixed effects (panel a) and the estimates of variance components for the random effects (panel b). The dots indicate medians, and the vertical lines indicate the approximate 90% credible interval. The bottom panels illustrate the predicted relative probabilities of selection in response to varying values of digestible energy (DE) for high predator risk and low predator risk for mountain lions (panel c) and wolves (panel d). The dark lines indicate means, and the light gray line indicates an approximate 90% credible interval.
