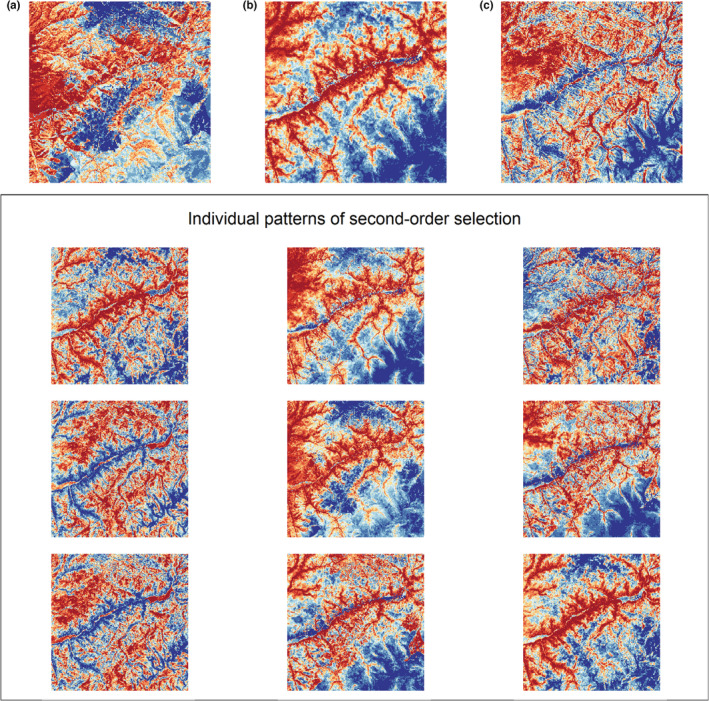
FIGURE 5.

Example of predicted relative probabilities of use for a small sample of individual female elk (n = 9). A small section of the study area was used for predictions. Panel a illustrates predicted values of digestible energy, panel b illustrates predicted values of relative probabilities of selection for mountain lions, and panel c illustrates predicted values of relative probabilities of use for wolves. The lower panel illustrates the variety of predicted relative probabilities of selection (2nd order) for elk in response to the underlying landscape of forage quality and risk. To aid illustration, all values were binned into 10 quantiles and coded from low (blue) to high (red).
