
FIGURE 7.
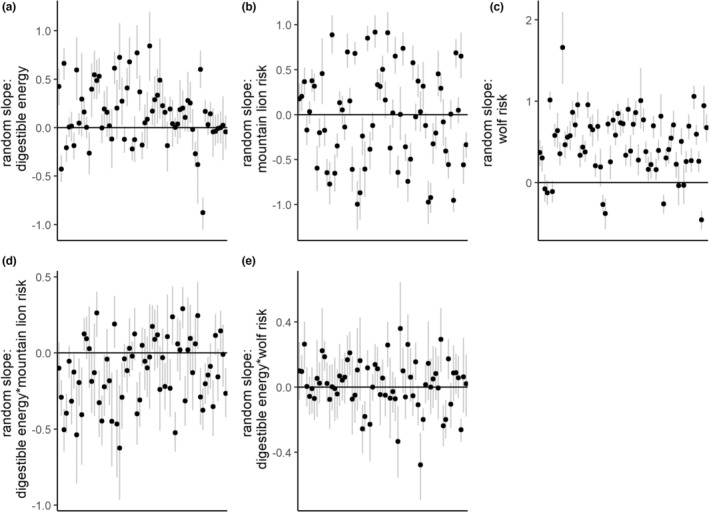
Estimated individual random coefficients (the combination of the fixed effects and random effects) for the third‐order resource selection function on the log scale. The x‐axes correspond to individual elk, and the y‐axes to the estimated regression coefficient. Black dots indicate the median estimate for the effect, and the light gray lines indicate an approximate 90% credible interval.