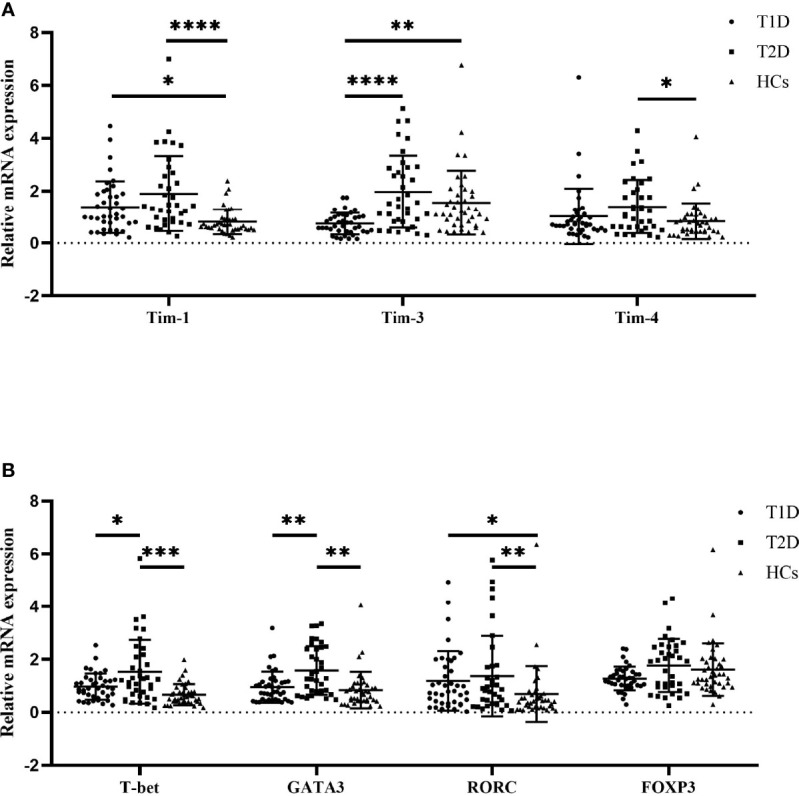
Figure 1.

The mRNA expression levels among T1D patients (n=40), T2D patients (n=36) and HCs (n=40) as quantified by RT–qPCR. (A) Tims mRNA expression in PBMCs from T1D patients, T2D patients and HCs. (B) T-cell subset-specific transcription factor mRNA expression in PBMCs from T1D patients, T2D patients and HCs. The error bars represent the standard deviation of the mean. *P<0.05; **P<0.01; ***P<0.001; ****P<0.0001.
