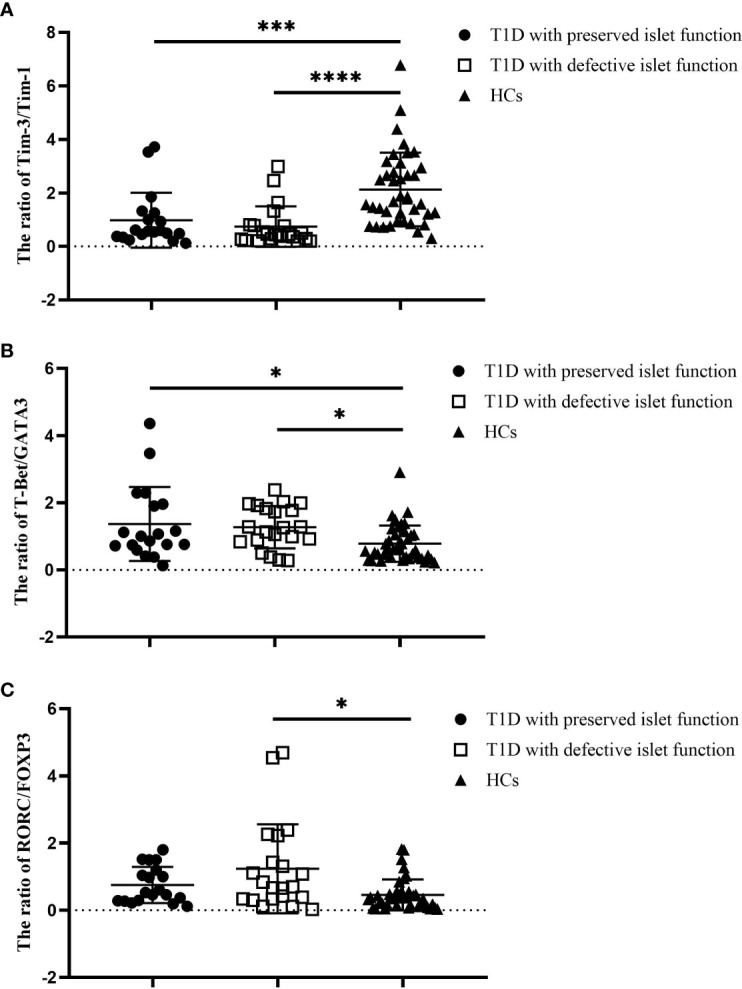
Figure 3.

The ratios of Tim molecules and T-cell subset-specific transcription factor expression in the T1D subgroups (n=40) and HCs (n=40). (A) The ratio of Tim-3 to Tim-1 in different T1D subgroups and the HC group. (B) The ratio of T-Bet to GATA3 in different T1D patient subgroups and the HC group. (C) The ratio of RORC to POXP3 in different T1D subgroups and the HC group. Error bars represent the standard deviation of the mean. *P<0.05; ***P<0.001; ****P<0.0001.
