Figure 4.
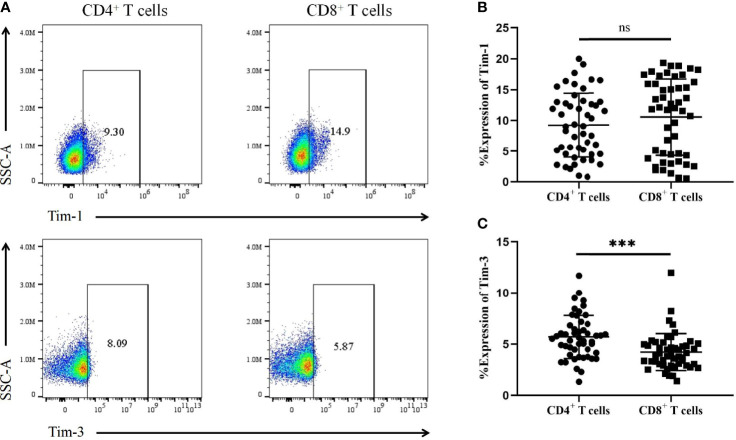
The expression of Tim-1 and Tim-3 in different T-cell subsets from T1D patients. (A) Representative plots showing the expression of Tim-1 and Tim-3 in different T-cell subsets. (B) The expression of Tim-1 on CD4+ and CD8+ T cells in T1D patients. (C) The expression of Tim-3 in CD4+ and CD8+ T cells in T1D patients. ns, no statistical difference; ***P<0.001.

