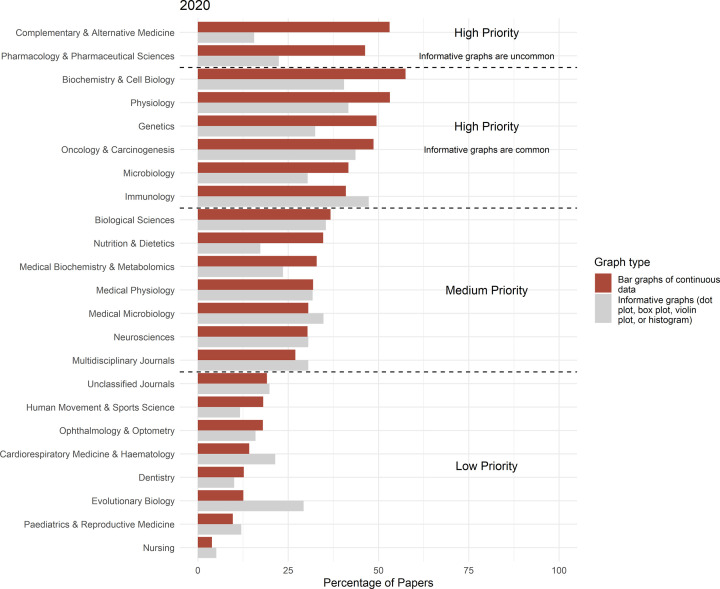
Figure 6. Identifying fields that would benefit from interventions.
Fields are divided into three priority groups, depending on the percentage of papers that use bar graphs to present continuous data (red bars; High priority: >40%; Medium priority: 30–40%; Low priority: <20%). The high-priority group includes two subgroups: one subgroup in which more informative graph types are less common, and a second subgroup in which more informative graph types are more commonly used. Training in how to create more informative graphs, and how to choose between dot plots, box plots, violin plots, and histograms may be especially critical for fields where more informative graphs are less common.

