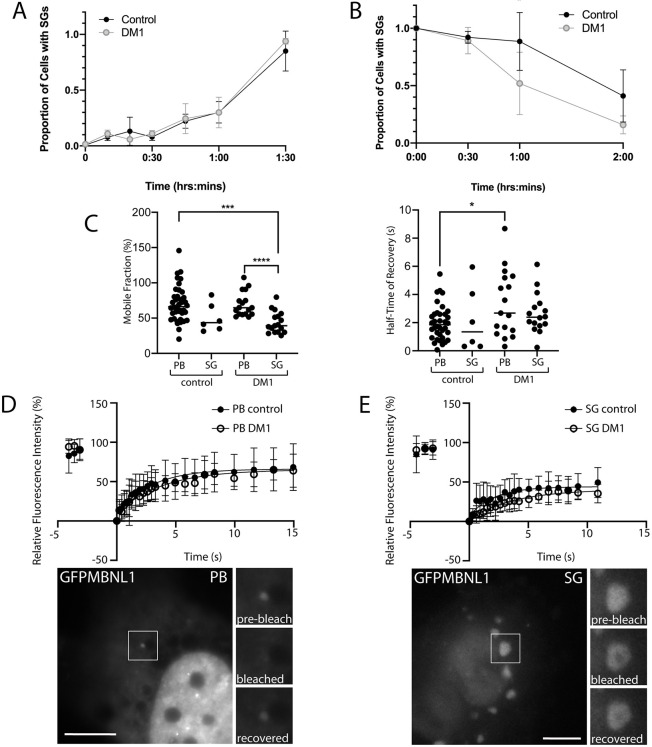
Fig. 2.
Kinetics analysis of SGs and P-bodies reveals increased rates of SG loss during stress recovery, and slightly altered MBNL1 dynamics in DM1 compared to control cells. (A) SG formation. Control and DM1 HLECs treated with 0.25 mM NaAsO2 were followed over 1.5 h during which the proportion of cells containing SGs was detected with antibody against endogenous TIA1. No significant differences were observed between DM1 and control cells. (B) SG recovery after pre-treatment with NaAsO2. Cells were pre-treated with NaAsO2 (0.5 mM for 90 minutes), washed thoroughly, and the proportion of cells containing SGs was detected over 2 h of recovery with antibodies against endogenous TIA1 and MBNL1. Compared with control cells, significantly fewer DM1 cells retain SGs at the 1 h time point. P<0.05 one-way ANOVA (n=50 cells per cell line per time-point); data shown are pooled from two independent experiments, obtained from three DM1 cell lines and two control cell lines (see Fig. S2 for individual data from each cell line). (C) Mobile fraction (left) and half-time of fluorescence recovery (right) of GFPMBNL1 within P-bodies (PB) and SGs (SG) in control and DM1 HLECs. *P<0.05; ***P<0.001; ****P<0.0001 Kruskal–Wallis. (D,E) Plotted is the relative fluorescence recovery of GFP-tagged MBNL1 (GFPMBNL1) in P-bodies (PB; panel D) and SGs (SG; panel E) over 15 s, following photobleaching, using a 488 nm laser pulse for 2.5 s. Closed circles indicate P-bodies or SGs in control cells [HLECs from CCat1 and CCat3 (see ‘Cell lines and cell culture’ in Materials and Methods), n=39 total for P-bodies and n=6 for SGs]; open circles indicate P-bodies or SGs in DM1 cells [HLECs from DMCat1, DMCat2 and DMCat4 (see ‘Cell lines and cell culture’ in Materials and Methods), n=17 total for P-bodies and n=17 for SGs]. All data are displayed as the mean±s.d. Representative images before photobleaching are shown below, magnifications of the boxed areas are shown on the right of each image, before and immediately after photobleaching, and following recovery. Scale bars: 7 µm.

