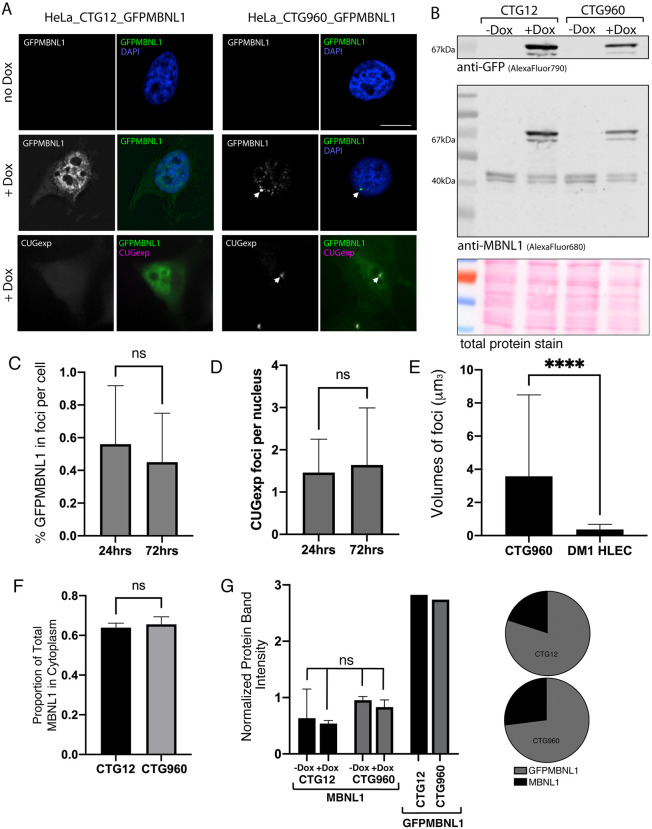
Fig. 3.
Simultaneous expression of a DMPK minigene and GFPMBNL1 models DM1. (A) HeLa cells containing a DMPK minigene with 12 (left) or 960 (right) CTG trinucleotide repeats and GFP-tagged MBNL1 (GFPMBNL1), under a bi-directional tetracycline responsive promoter. Cells grown in the absence of doxycycline (−Dox) (top row) show no expression of GFPMBNL1 in the cytoplasm or nucleus (counterstained with DAPI, blue on overlay). Cells induced with 1 µg/ml Dox (+Dox) for 48 h show clear expression of GFPMBNL1 (middle row, green on overlay), forming distinct nuclear foci (arrows) in the CTG960 line and the characteristic localisation of GFPMBNL1 to the nucleus and cytoplasm in the CTG12 line. RNA FISH using a probe against the CUGexp RNA (bottom row, magenta on overlay) confirms that the GFPMBNL1 nuclear foci are genuine CUGexp foci in the CTG960 line (right) and that no CUGexp RNA is detected in the CTG12 line (left). Scale bar: 10 µm. (B) Immunoblotting of PAGE-separated whole-cell lysates using antibodies against GFP (AlexaFluor790; top) and MBNL1 (AlexaFluor680; centre) confirmed successful expression of GFPMBNL1 (67 KDa) in both cell lines, i.e. CTG12 (left) and CTG960 (right), following treatment with Dox for 48 h – but not in uninduced cells (−Dox). All samples show the characteristic double-band just above the 40 kDa marker for endogenous MBNL1 (centre). Ponceau S staining of total protein (bottom) was used as loading control. (C) The percentage of total cellular GFPMBNL1 localised to foci is small (<1%) and does not change between 24 h and 72 h of induction (n=48 cells at 24 h and n=68 cells at 72 h, pooled from two independent experiments; unpaired t-test). (D) The number of CUGexp foci per nucleus is small (mean 1.7 and 2.4 after 24 h and 72 h, respectively; n=84 cells at 24 h and n=117 cells at 72 h, pooled from two independent experiments; Mann–Whitney U test). (E) CUGexp foci are larger in HeLa cells than in DM1 HLECs (n=419 cells for HeLa, n=86 cells for HLEC; ****P<0.0001 Mann–Whitney U test. (F) The proportion of total cellular GFPMBNL1 in the cytoplasm is similar in CTG12 and CTG960 cell lines after 72 h of induction (n=10 cells per line). (G) Expression levels of endogenous MBNL1 are not significantly different in CTG12 and CTG960 cells, whether induced with Dox or not (ANOVA test, mean of two biological repeats adjusted for gel loading by using tubulin. Expression levels of GFPMBNL1 and the ratio of GFPMBNL1 to endogenous MBNL1 as shown in panel B are similar in CTG12 and CTG960 cells, adjusted for the number of cells expressing GFPMBNL1 in each cell line. All data are displayed as the mean+s.d.

