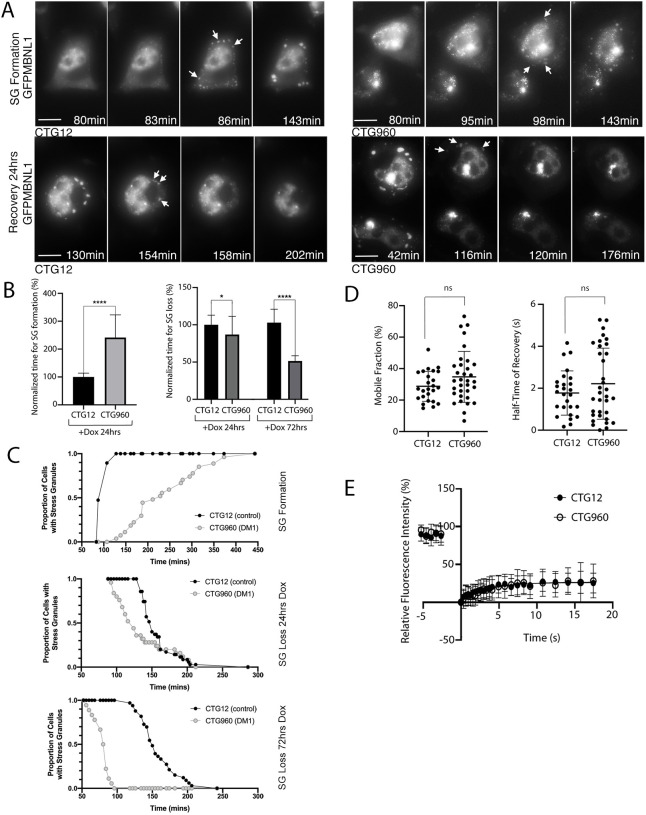
Fig. 5.
Kinetics analysis of SGs reveals altered formation and dispersal of SGs in an inducible cell model of DM1, and increased variance in MBNL1 dynamics. (A) Selected time-points from representative time-lapse images showing the formation (top) and dispersal during recovery (bottom) of SGs (arrows) in doxocycline (Dox)-induced CTG12 (left) and CTG960 (right) HeLa cell lines treated with NaAsO2 to induce SGs. The ‘formation time’ of SGs was recorded as the time-point at which at least five SGs were first detected. The ‘dispersal time’ of SGs was recorded as the first time-point at which SGs could no longer be clearly detected. Scale bars: 10 µm. See also Movies 1-4. (B) CTG12 control and CTG960 DM1 model cells were induced with Dox (+DOX), and time of SG formation (left) and SG loss (right) were analysed after treatment with NaAsO2 (analysed immediately for SG formation, and after 90 minutes of pre-treatment and drug removal for SG dispersal). Bar graphs show the time of SG formation after induction for 24 h (left) and time of SG loss after induction for 24 h or 72 h (right) in CTG960 cells normalised to the mean values measured in control (CTG12) cells (set as 100%). CTG12, n=19 cells; CTG960, n=27 cells for SG formation; ****P<0.0001. CTG12, n=35 cells; CTG960, n=25 cells for SG loss at 24 h; *P<0.05. CTG12 n=33; CTG960 n=18 cells for SG loss at 72 h; ****P<0.0001 unpaired t-tests. Each graph is representative of two independent experiments. (C) The proportion of cells containing SGs was plotted against time for the full time-course of treatment with or recovery from treatment with NaAsO2. This emphasises the difference in dynamics of SG formation (top) between cells expressing CTGexp RNA (DM1) and control RNA, but also the differences regarding SG loss when cells were Dox-induced for 24 h (centre) or 72 h (bottom). The increased difference seen with RNA induction for 24 h or 72 h confirms that these changes are due to CUGexp expression, rather than random variation between the cell lines. (D) The mobile fraction (left) and half-time of fluorescence recovery (right) of GFP-tagged MBNL1 (GFPMBNL1) in SGs is similar in CTG960 and CTG12 HeLa cells (Mann–Whitney U test; ns, not significant). (E) Plotted is the relative fluorescence recovery of GFPMBNL1 in SGs over time in response to photobleaching (488 nm laser, 2.5 s pulse), see also Fig. S7. Closed circles, SGs in HeLa_CTG12_GFPMBNL1 cells (n=41); open circles, SGs in HeLa_CTG960_GFPMBNL1 cells (n=25). All data are displayed as the mean±s.d.

