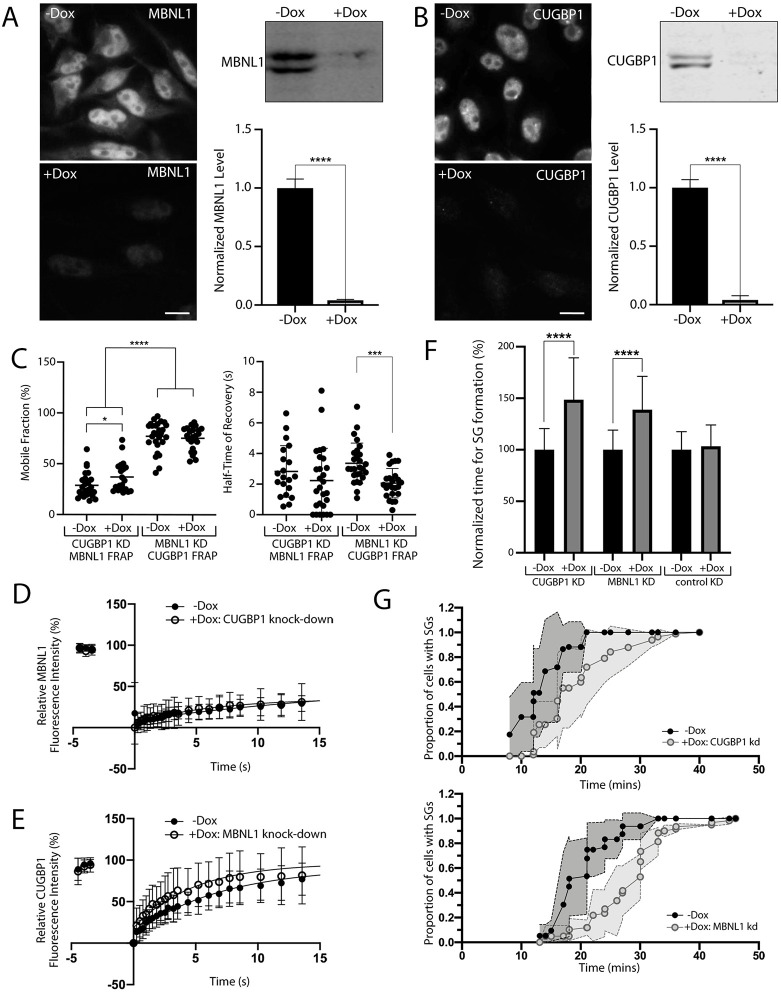
Fig. 6.
SG dynamics are altered by reduction in expression of MBNL1 or CUGBP1. (A,B) Stable cells containing Dox-inducible shRNAs targeting MBNL1 (A) or CUGBP1 (B) were treated with (+) or without (–) Dox. Levels of MBNL1 or CUGBP1 were validated using antibodies against endogenous MBNL1 and endogenous CUGBP1, respectively, in immunocytochemistry (left) and immunoblotting (right) experiments. Scale bars: 10 µm, ****P<0.0001 (unpaired t-test, data from three independent experiments each). (C) Mobile fractions (left) and half-time of fluorescence recovery (right) of GFP-tagged MBNL1 or GFP-tagged CUGBP1 in SGs of +Dox or –Dox cells with induced knockdown (KD) of either CUGBP1 or MBNL1. **** P<0.0001, *P<0.05, ***P<0.001 (Mann–Whitney U test). (D) Curve fit for FRAP of GFP-tagged MBNL1 in SGs of +Dox cells with CUGBP1 knockdown (closed circles, n=21 cells) compared to that of −Dox control cells (open circles, n=27 cells). (E) Curve fit for FRAP of GFP-tagged CUGBP1 in SGs of +Dox cells with MBNL1 knockdown (closed circles, n=24) compared to that of −Dox control cells (−Dox, open circles, n=27). (F) Time of SG formation in response to NaAsO2 in cell lines with Dox-inducible CUGBP1 and MBNL1 knockdown compared to a negative control, normalised to the mean values for each cell line without knockdown (-Dox), set at 100%. ****P<0.0001 (unpaired t-tests. For CUGBP1 KD -DOX: n=96; +DOX: n=107; for MBNL1 KD -DOX: n=56; +DOX: n=60; for control (luciferase) KD -DOX: n=20; +DOX: n=14). Data shown are pooled from three independent experiments. (G) Plotted is the proportion of SG-containing cells over time for the full time-course of SG formation, emphasising the difference in the dynamics of SG formation in cells with reduced CUGBP1(top) or MBNL1(bottom) levels compared to that of control cells. Grey shading indicates ±s.d. for the curves it surrounds. All data are displayed as the mean±s.d.

