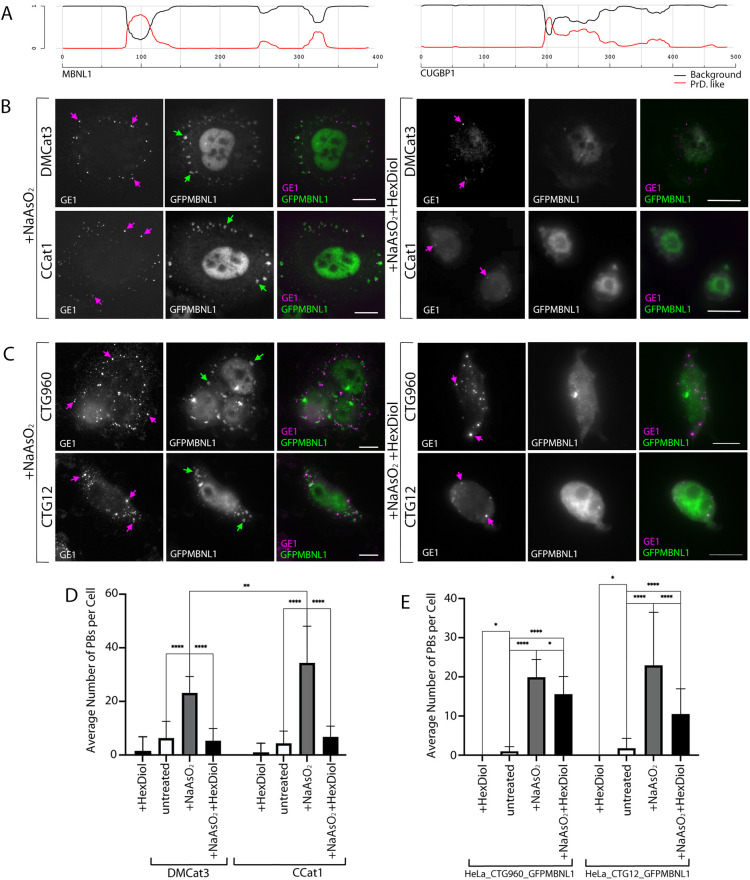
Fig. 7.
P-bodies and SGs both show characteristics of LLPS structures, with PB stability increased by induction of CTGexp repeats. (A) Graph showing the predicted PrLDs for MBNL1 (left) and CUGBP1 (right), generated using PLAAC software (Lancaster et al., 2014). Parameters used were a core length of 30 amino acids and a background frequency for homo sapiens (see Materials and Methods). PrLDs are depicted where the probability is >0.5 on the y-axis. Red lines, PrLD probability score; black line, background probability score. (B) DM1 patient (DMCat3, top row) and control (CCat1, bottom row) HLECs (see: ‘Cell lines and cell culture’ under Materials and Methods) treated with NaAsO2 (left) or with NaAsO2 followed by 1,6-hexanediol (right). SGs (green arrows) containing GFP-tagged MBNL1 (GFPMBNL1; green in merged images) are clearly seen cells treated NaAsO2 alone but absent in cells treated with NaAsO2 followed by 1,6-hexanediol. P-bodies (magenta arrows) detected with antibodies against endogenous GE1 (magenta in merged images) are numerous in cells treated with NaAsO2 alone but less numerous in cells treated with NaAsO2 followed by 1,6-hexanediol. Scale bars: 10 µm. (C) HeLa_CTG960_GFPMBNL1 cells treated with NaAsO2 (left) or with NaAsO2 followed by 1,6-hexanediol (right). SGs (green arrows) containing GFPMBNL1 (green in merged images) are clearly seen in NaAsO2-treated cells but absent in cells treated with NaAsO2 followed by 1,6-hexanediol. P-bodies (magenta arrows) detected with antibodies against endogenous GE1 (magenta in merged images) are numerous in cells treated with NaAsO2 alone but less numerous in cells treated with NaAsO2 followed by 1,6-hexanediol. Scale bars: 10 µm. (D) Shown are the average number of P-bodies per cell in DM1 (DMCat3) and control (CCat1) HLECs treated with 0.5 mM NaAsO2 or treated with 0.5 mM NaAsO2 followed by 5% 1,6-hexanediol compared to untreated cells. n=53 (DMCat3), n=53 (CCat1); **P<0.05, ****P<0.0001; one-way ANOVA, pooled from three independent experiments in each case. All data are displayed as the mean±s.d. (E) P-bodies per cell in HeLa cells with (HeLa_CTG960_GFPMBNL1) and without (HeLa_CTG12_GFPMBNL1) CTGexp foci treated with 0.5 mM NaAsO2 or treated with 0.5 mM NaAsO2 followed by 5% 1,6-hexanediol compared to untreated cells. *P<0.05, ****P<0.0001. n=108 (HeLa_CTG960_GFPMBNL1); n=69 (HeLa_CTG12_GFPMBNL1); Kruskal–Wallis, pooled from three independent experiments in each case. All data are displayed as the mean+s.d.

