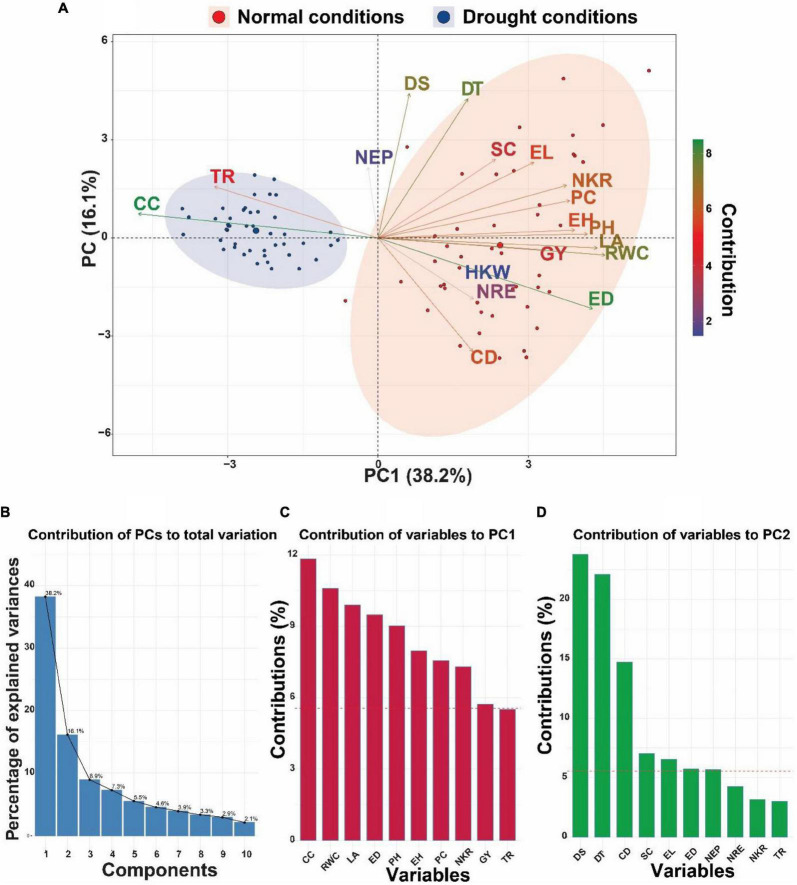
FIGURE 2.
(A) Principal component analysis (PCA)-biplot of 45 maize inbred lines based on the variance in 18 morpho-physiological and biochemical traits grown under normal and drought conditions. Arrows indicate the strength of the trait influence on the first two PCs. The darker green and longer arrows indicate a higher contribution, while the darker blue and shorter arrows indicate the lower contribution of the variables. (B) Bar plots with% variation above represent contribution of each PC to the total variation. (C,D) Red dashed lines in the bar plots denote reference lines and the variable bars above the reference lines are considered most important in contributing to the PC1 and PC2. DT, days to 50% tasseling; DS, days to 50% silking; PH, plant height (cm); EH, ear height (cm); NEP, no. of ears/plant; EL, ear length (cm); ED, ear diameter (cm); CD, cob diameter (cm); NRE, no. of row/ear; HKW, 100-kernel weight (g); NKR, number of kernel/row; GY, grain yield (ardbe/fed); LA, leaf area (cm2); RWC, relative water content (%); PC, proline content (mg g– 1); CC, chlorophyll content (SPAD); TR, transpiration rate (mmol m– 2 s– 1); SC, stomatal conductance (mol m– 2 s– 1).

