
FIGURE 4.
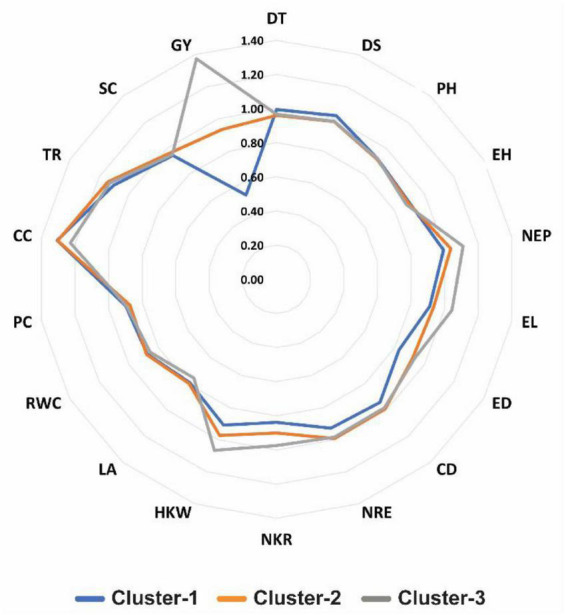
Radar plot showing drought tolerance index (DTI) values for 18 studied traits in three clusters of 45 maize inbred lines. Number in red color in the figure represent the complete scale of DTI. DT, days to 50% tasseling; DS, days to 50% silking; PH, plant height (cm); EH, ear height (cm); NEP, no. of ears/plant; EL, ear length (cm); ED, ear diameter (cm); CD, cob diameter (cm); NRE, no. of row/ear; HKW, 100-kernel weight (g); NKR, number of kernel/row; GY, grain yield (ardbe/fed); LA, leaf area (cm2); RWC, relative water content (%); PC, proline content (mg g– 1); CC, chlorophyll content (SPAD); TR, transpiration rate (mmol m– 2 s– 1); SC, stomatal conductance (mol m– 2 s– 1).