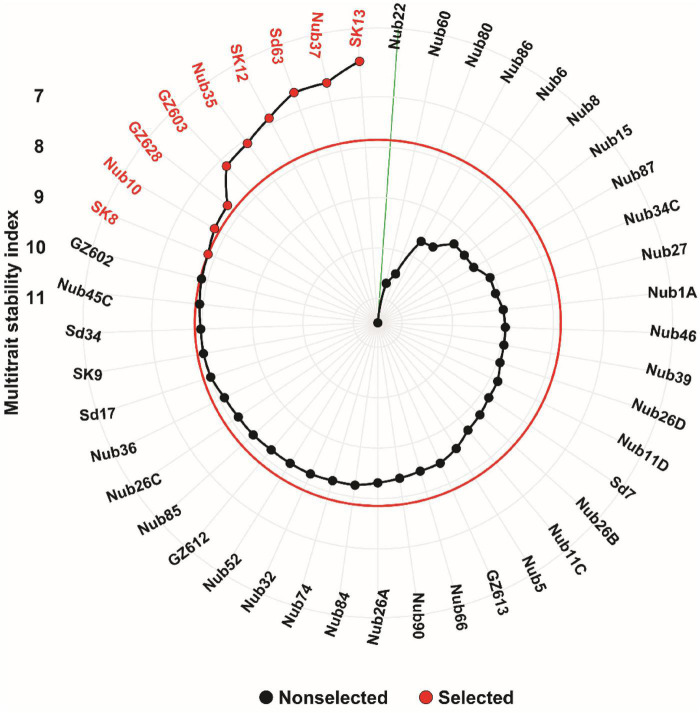
FIGURE 6.
Ranking of 45 maize inbred lines based on MTSI values performed on 18 traits. The most stable inbred lines are shown in red color and the red circle represents the cut-point according to the selection intensity of 20%. The green line connected to the center of the plot represents the least stable inbred line with highest MTSI value.

