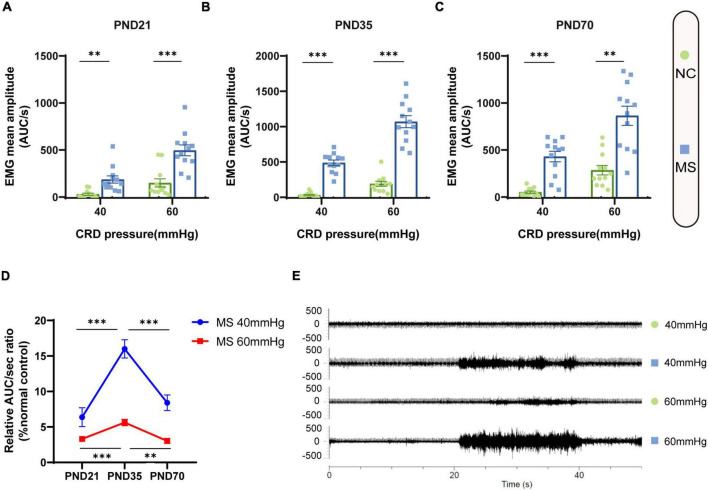
FIGURE 2.
Visceral hypersensitivity occurred in MS rats from the post-weaning period to adulthood and was more pronounced on PND35. (A–C) VMR amplitudes to 40 and 60 mmHg CRD on PND21 (A), PND35 (B), and PND70 (C) were significantly higher than those of NC rats. On PND21: NC, n = 12; MS, n = 12. On PND35: NC, n = 12; MS, n = 12. On PND70: NC, n = 12; MS, n = 12. All data were given as mean ± SEM. **P < 0.01, ***P < 0.001, two-tailed unpaired Student’s t-test. (D) The relative VMR ratios of MS to NC rats in three different age periods. The relative VMR ratios of MS rats to NC rats on PND35 were significantly higher than that of PND21 and PND70. All data were given as mean ± SEM. **P < 0.01, ***P < 0.001, one-way ANOVA test followed by least-significant difference test. AUC/s, the area under the curve per second. (E) The representative external abdominal oblique muscle EMG recordings of NC and MS rats.

