
FIGURE 5.
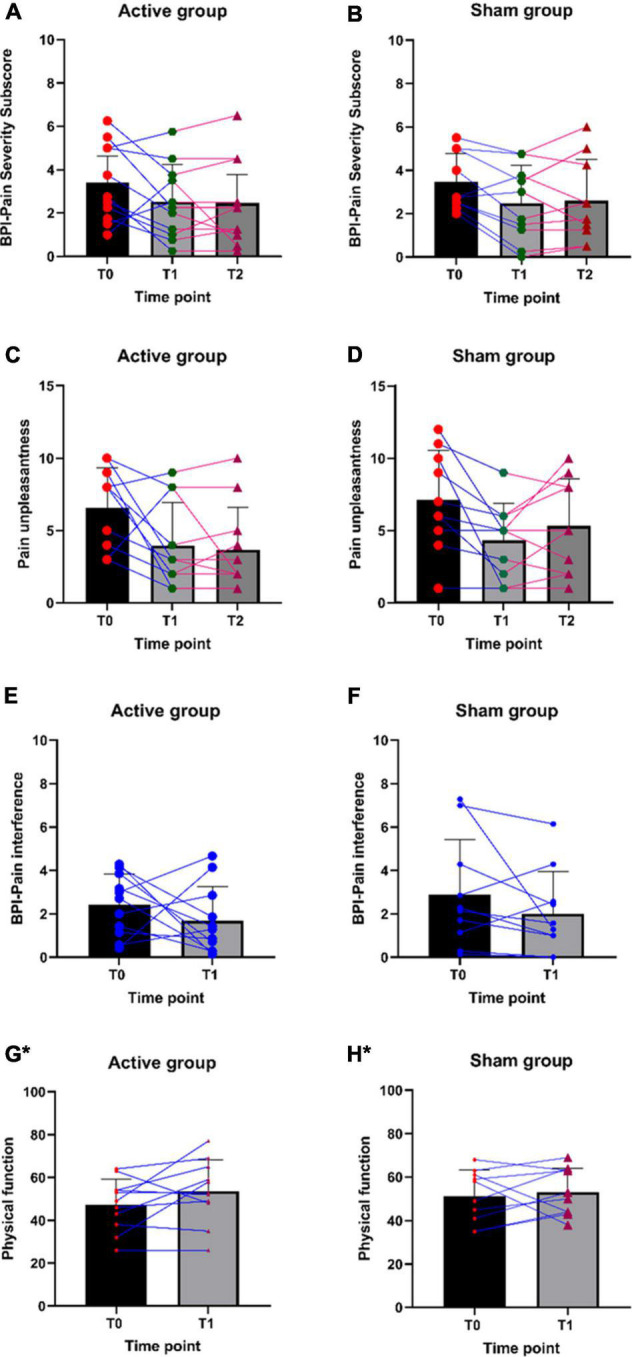
(A–H) Individual participant data for pain severity, pain unpleasantness, pain interference, and physical function scores. *Higher the score, the higher the physical function.
Official websites use .gov
A
.gov website belongs to an official
government organization in the United States.
Secure .gov websites use HTTPS
A lock (
) or https:// means you've safely
connected to the .gov website. Share sensitive
information only on official, secure websites.
(A–H) Individual participant data for pain severity, pain unpleasantness, pain interference, and physical function scores. *Higher the score, the higher the physical function.