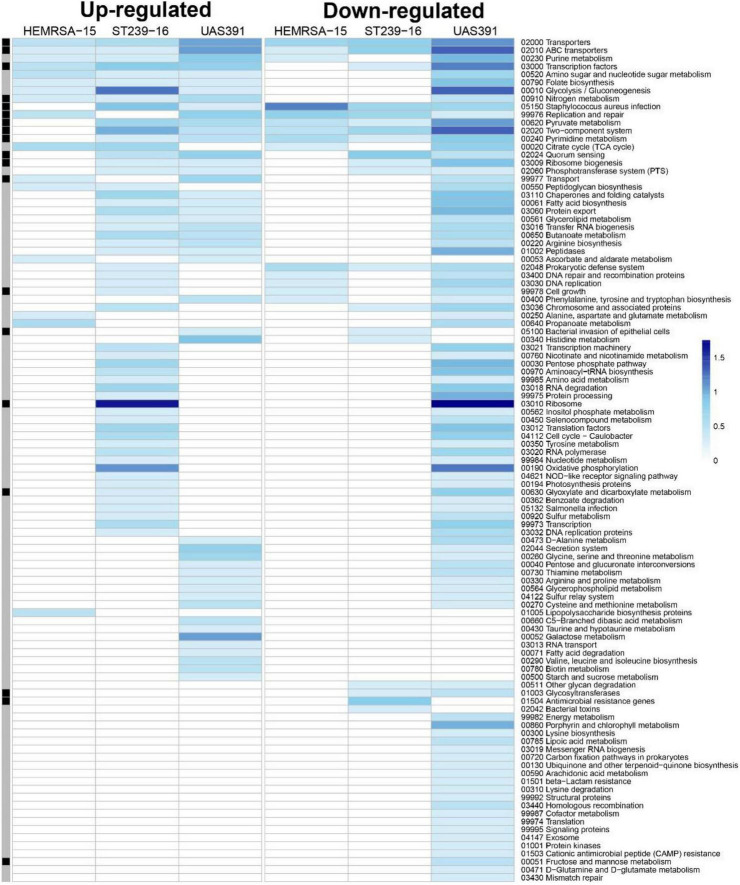
FIGURE 2.
Gene expression analysis of 48-h biofilm and planktonic phenotypes in three representative MRSA strains: HEMRSA-15 (left), ST239-16 (middle), and UAS391 (right). Metabolic pathway signatures of biofilms compared to planktonic bacteria after 48 h of growth. Identified DEGs were mapped against the KEGG database to obtain KO terms and associated metabolic pathways. Color-coded cells represent the number of enriched genes [log10(1 + number of enriched genes)] in the respective KEGG pathway in accordance with the color scale. Black–gray marking indicates whether some enriched genes in the KEGG pathway are linked to the accessory genome (black) or not (gray). Two biological repeats were used for each phenotype in each strain across time points.

