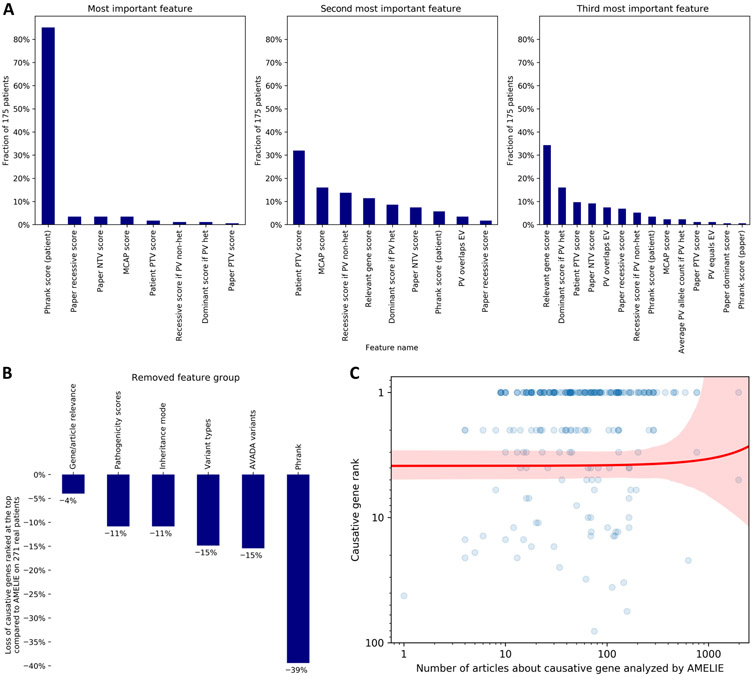
Fig. 3. Investigating AMELIE’s gene ranking performance.
(A) For each of the 175 patients with AMELIE causative gene rank 1 among all (n = 271) real DDD, Stanford, and Manton patients, the 27 features to the AMELIE classifier were ranked by their contribution to the top-ranked article’s high score. The panels (left to right) show the fraction of patients for which certain features were ranked most, second most, or third most contributing. PTV, protein-truncating variant; NTV, non–protein-truncating variant; MCAP, Mendelian clinically applicable pathogenicity score, an in silico pathogenicity score; PV, patient variant; het, heterozygous; EV, full-text article–extracted variant. (B) Retraining the AMELIE classifier with fivefold cross-validation, each time omitting one of AMELIE’s six feature groups, shows the degree to which feature groups aided performance across all (n = 271) DDD, Stanford, and Manton patients. (C) Each blue dot represents one of (n = 271) real DDD, Stanford, or Manton patients in this log-log plot. The red line is a linear regression line between number of articles about causative gene (x axis) and causative gene rank (y axis), with red denoting the 95% confidence interval.

