
Figure 8.
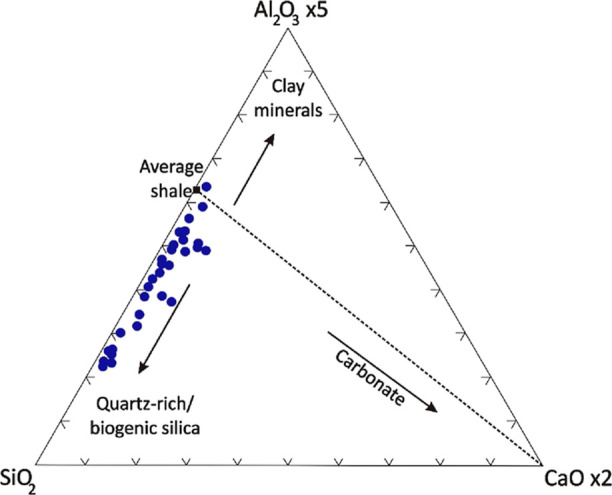
Ternary diagram of SiO2-5*Al2O3-2*CaO illustrating lithological differences within the Kharita Formation in the BED 2–3 well. All samples scatter toward a mixing line between the average shale61 and SiO2–Al2O3 line with minor content of the carbonate fractions.