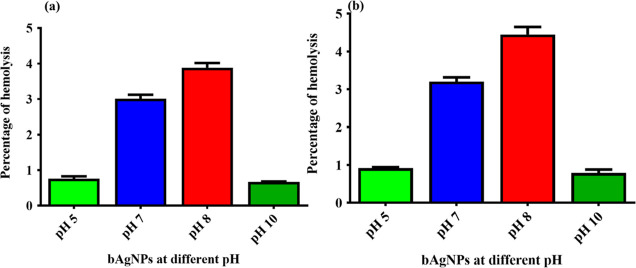
Figure 3.
Hemocompatibility assay of bAgNPs synthesized at different pH values against (a) rat RBCs and (b) human RBCs. The values presented are mean ± SE and data and were analyzed using GraphPad Prism 5.0 (GraphPad software) using ANOVA followed by Tukey’s multiple comparison test. No statistical significant difference was observed among the different bAgNPs and p > 0.05.

