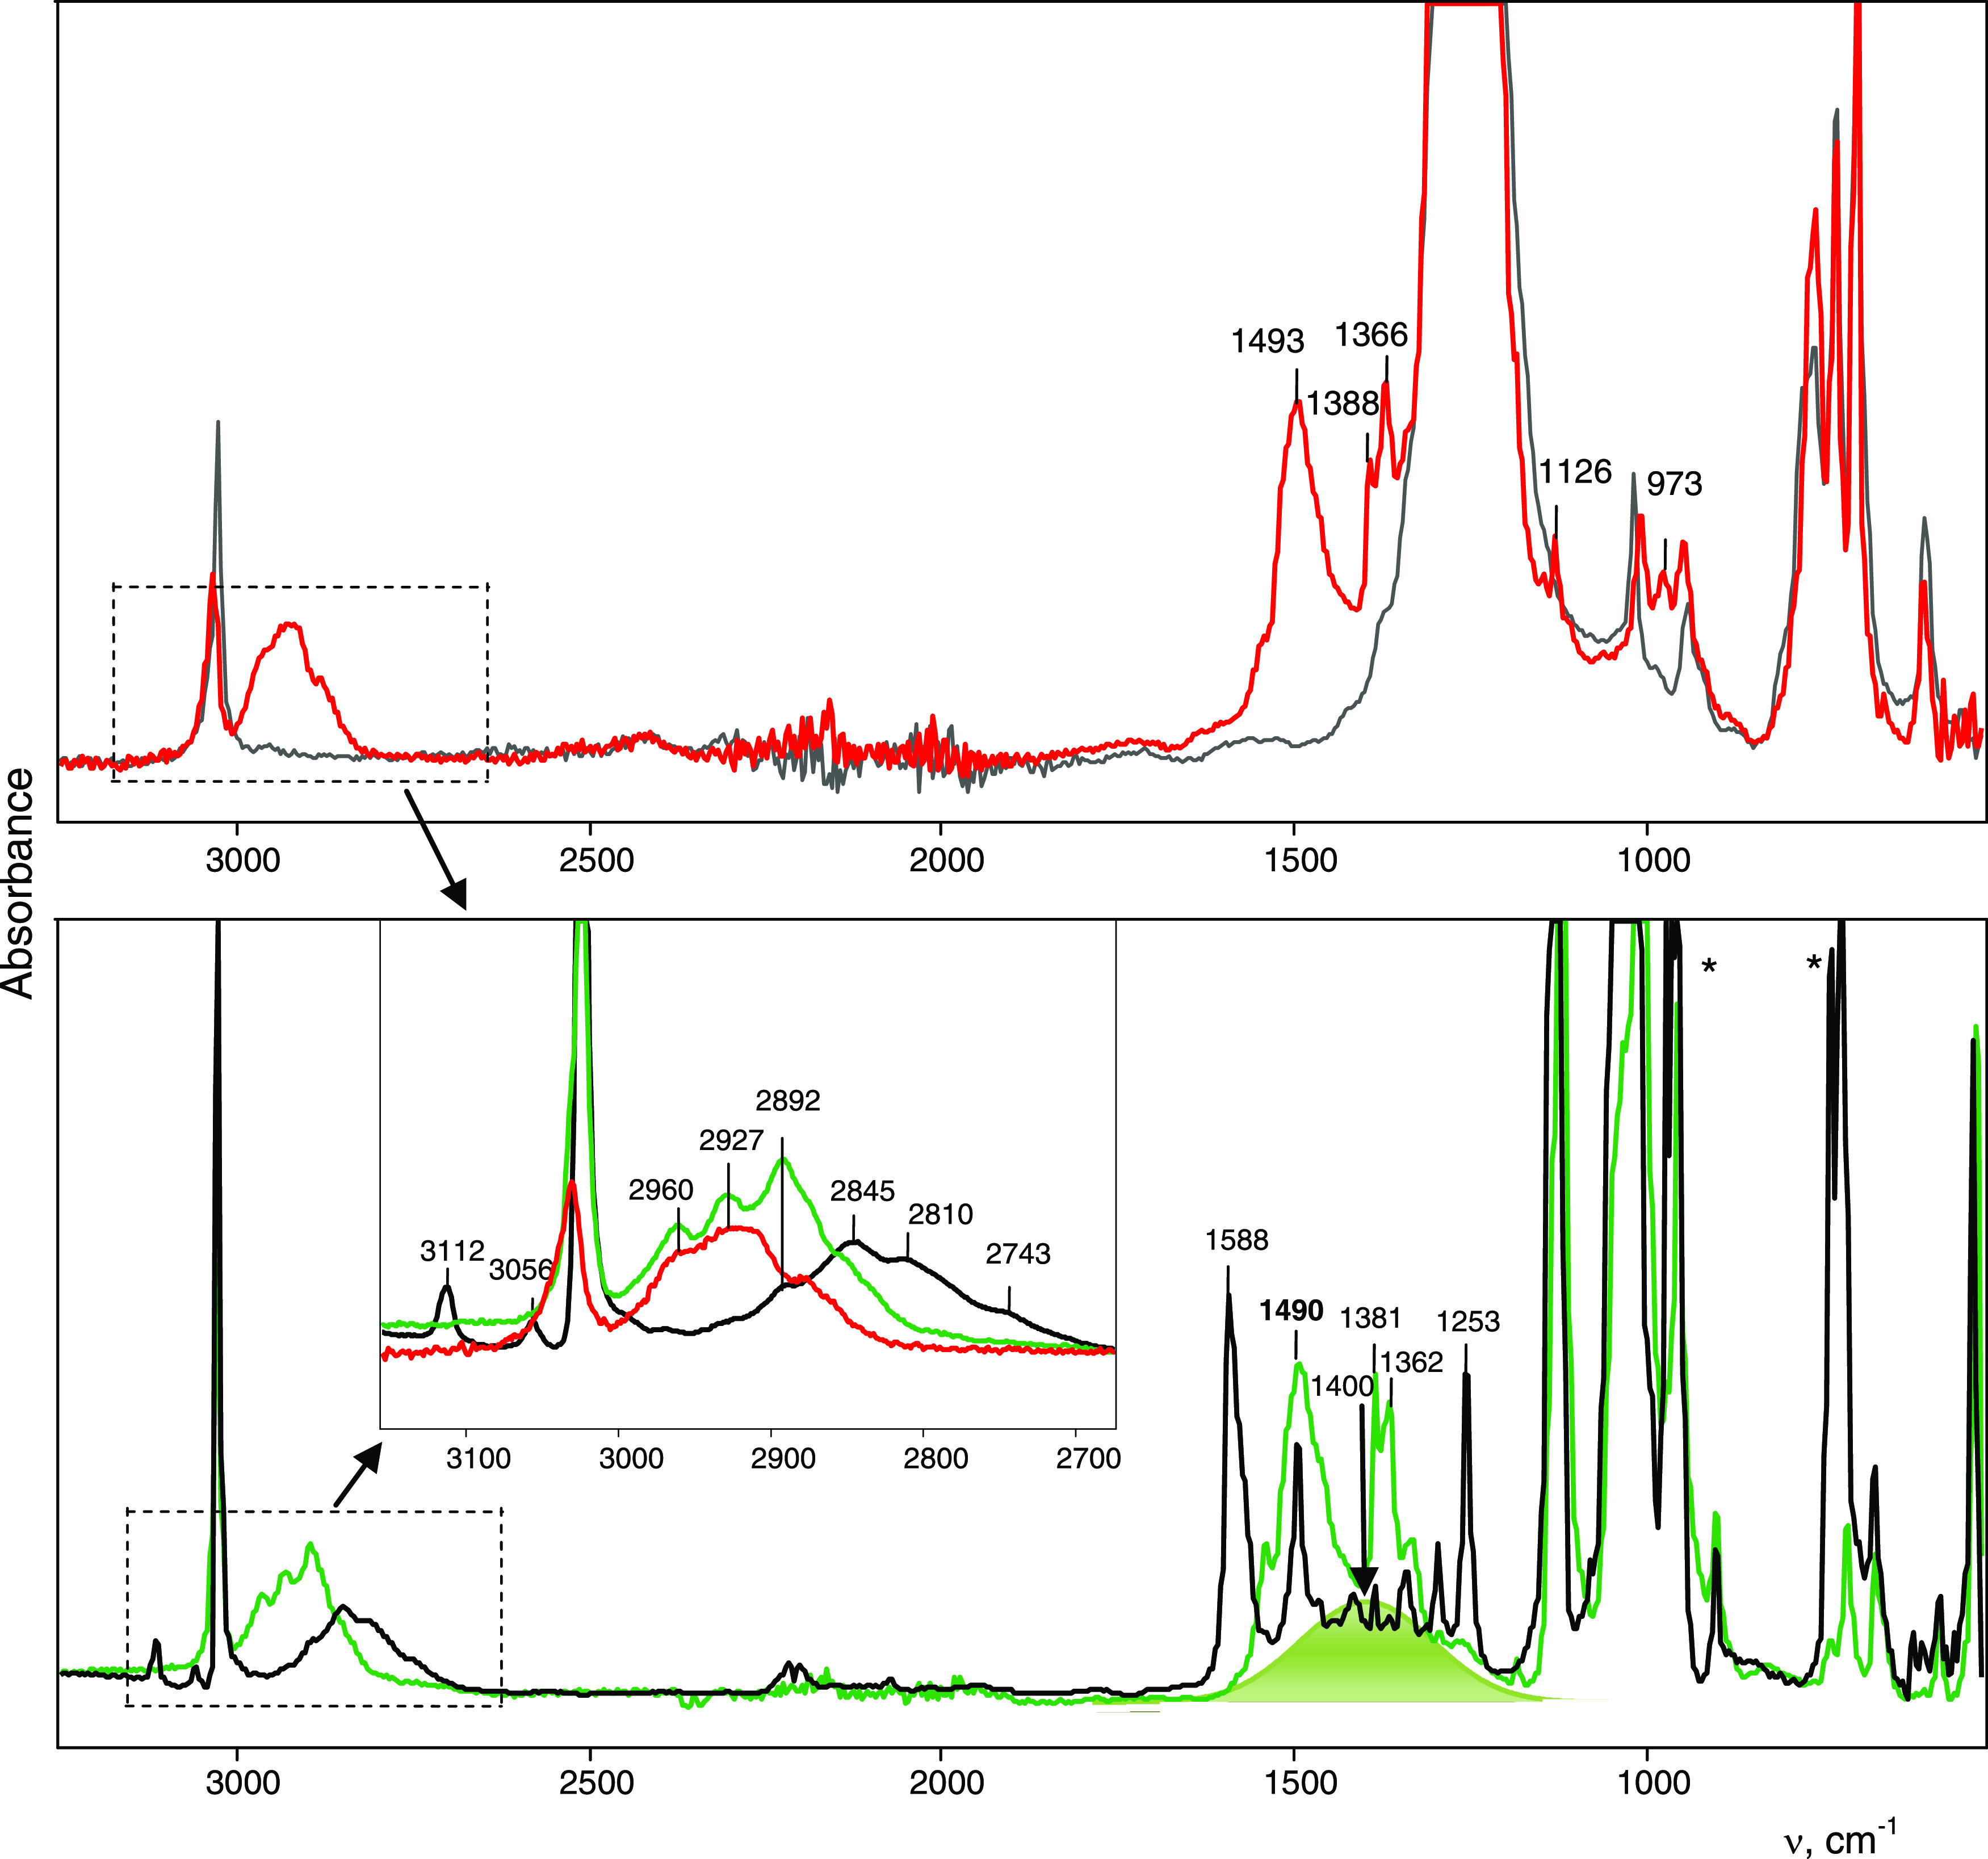
Figure 11.

ATR IR spectra (with ATR corrections) of cations I/II (green) and III (red) in their crystal salts with anions {Cl11–} and {F11–}, respectively, and the IR spectrum (in transmission mode) of amorphous salt C4H7+{Cl11–} (black). To illustrate the spectrum of the {F11–} anion, an IR spectrum of the Cs{F11} salt is given (gray). Two intense bands of the adsorbed CD2Cl2 molecules that were not removed by evacuation after we washed the amorphous salt with d2-DCM are marked with an asterisk. Intense bands with unspecified frequencies belong to the anion. Broad intense absorption in the region ∼1400 cm–1 is shaded in green.
