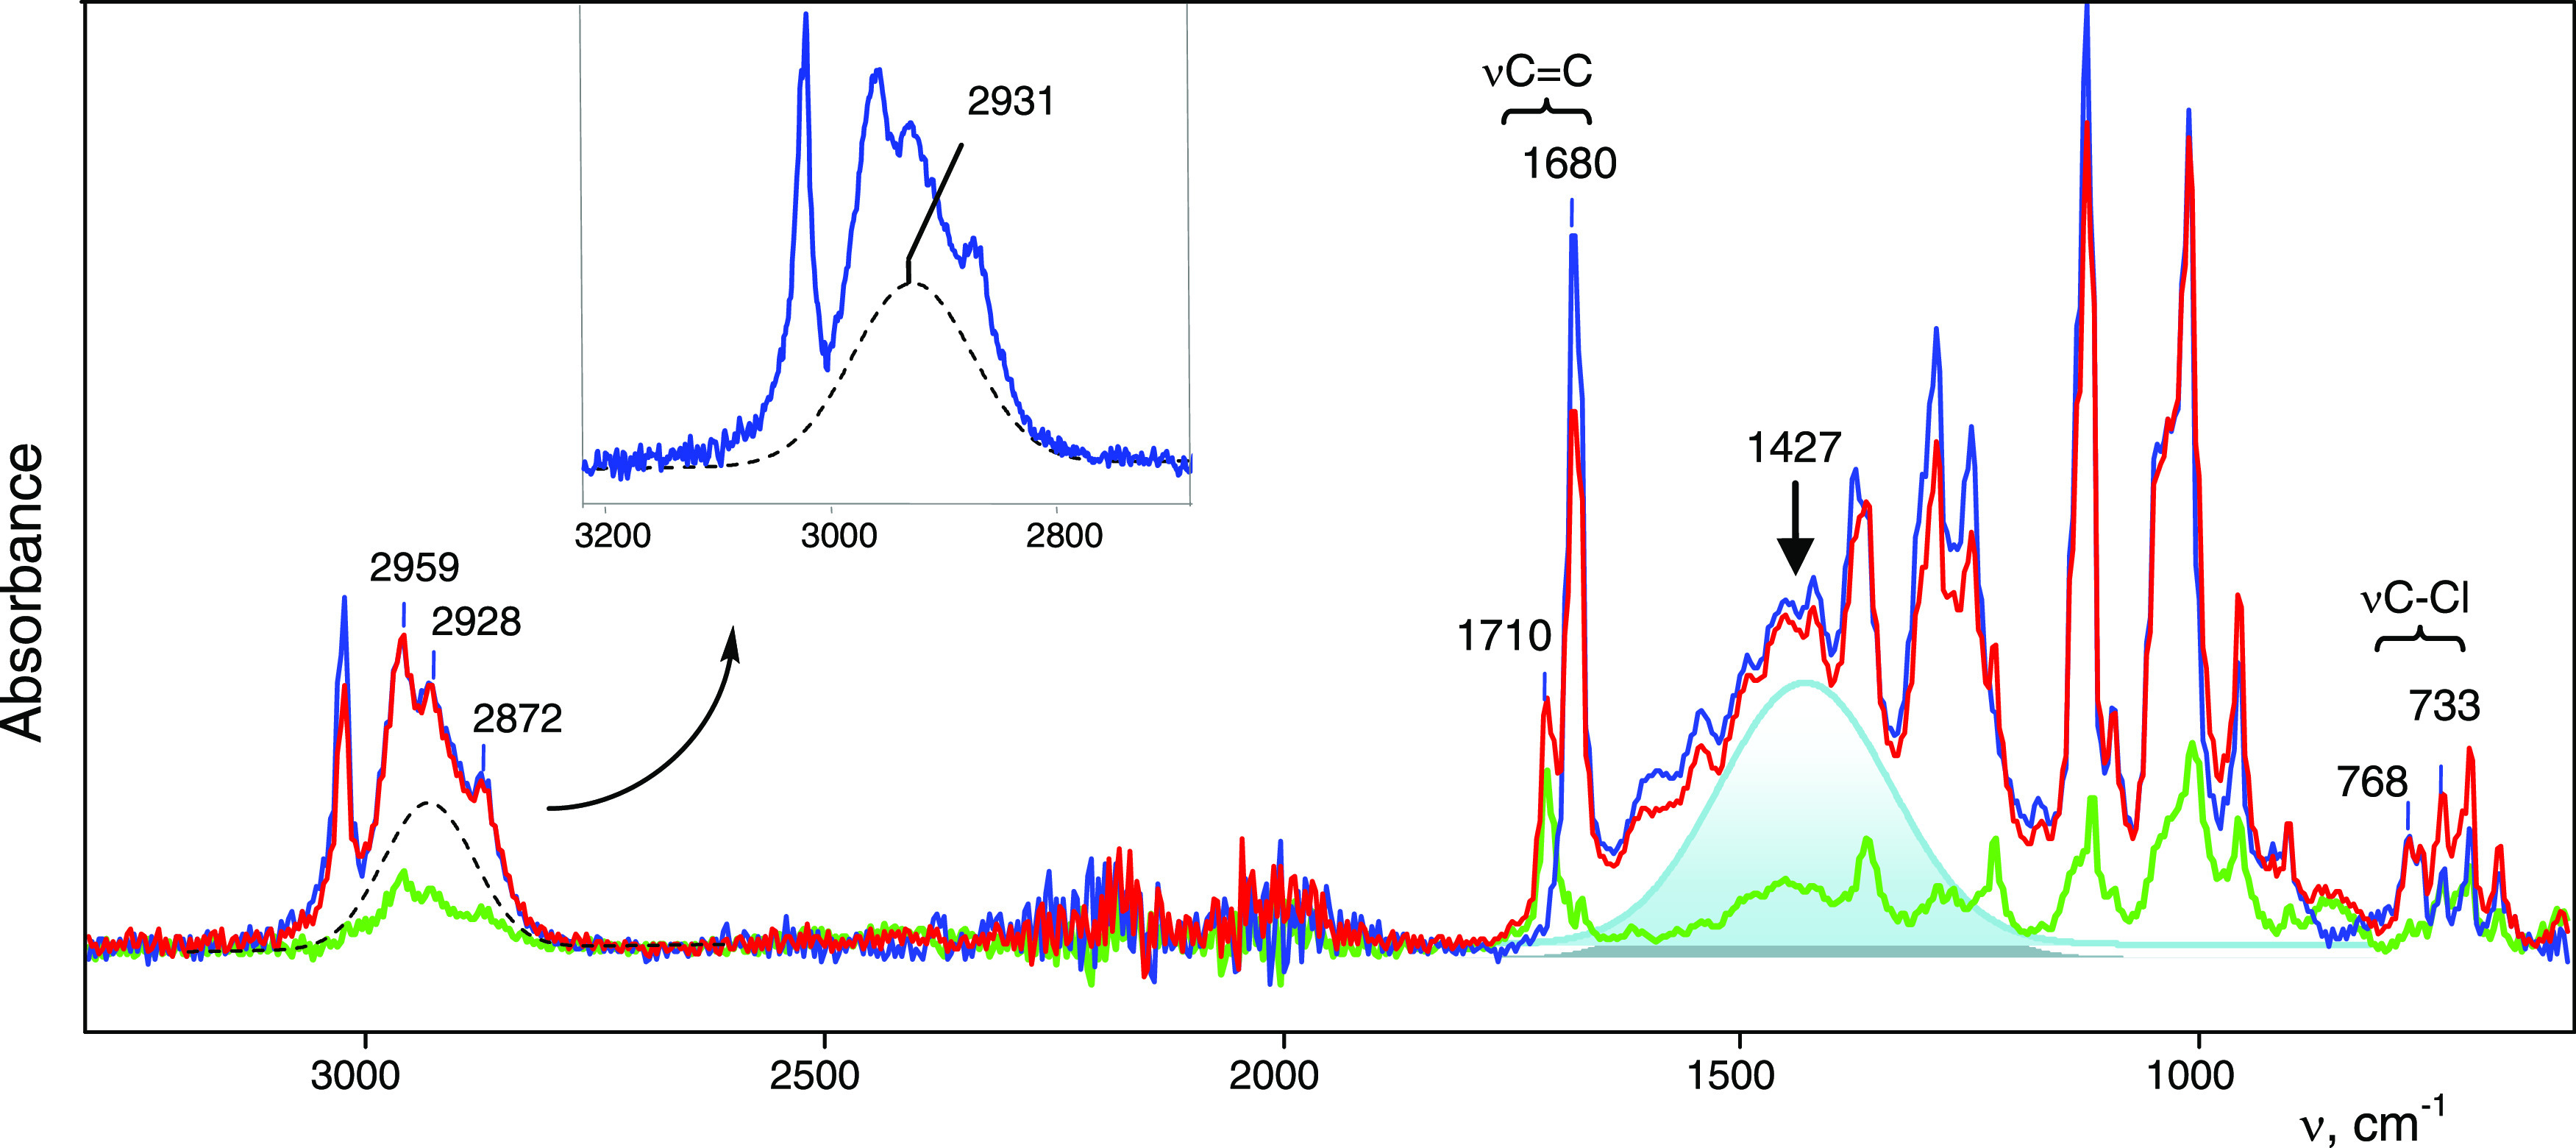
Figure 2.

ATR IR spectrum (with ATR correction) of the crystal salt of C4HmCl+{Cl11–} after X-ray-structural analysis, as recorded within the first minute after crushing on the ATR accessory (red) and repeating the recording in 3–4 min (blue). The isomer B spectrum, obtained by subtracting the “blue” spectrum from the “red” spectrum is green. Broad intense absorption at ∼1400 cm–1 is shaded in light blue.
