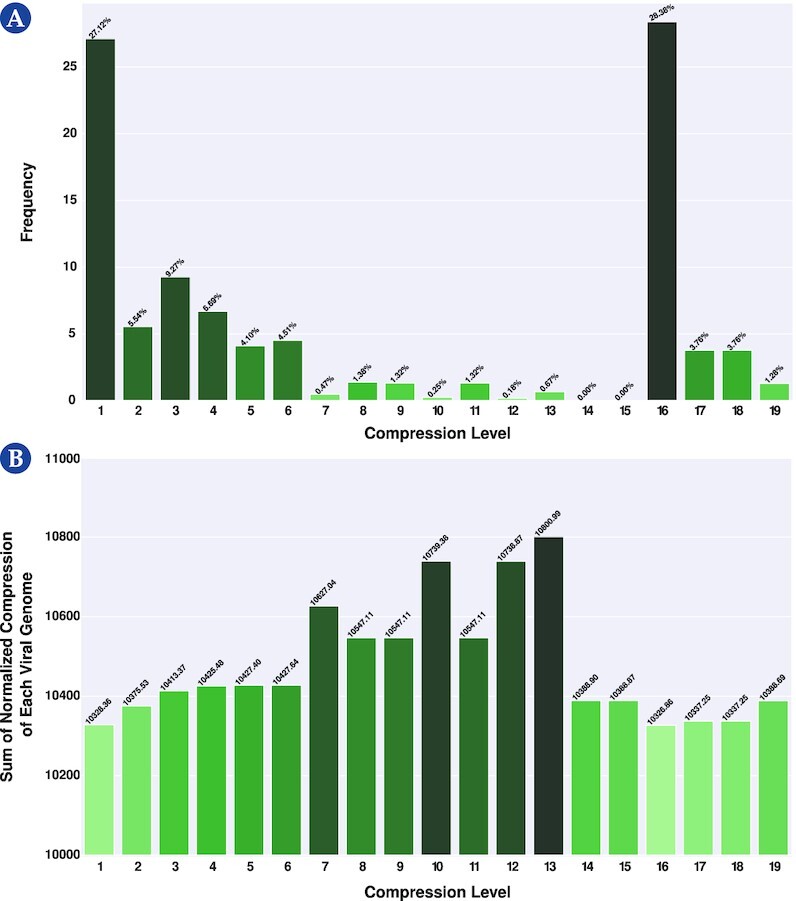
Figure 1.

: Selection of a level for GeCo3 from a pool of 19 levels. (A) Frequency where each level provided the best NC results. (B) The sum for each level of the NC from the compression of all reference genomes. For better visualization, please visit the website https://asilab.github.io/canvas/.
