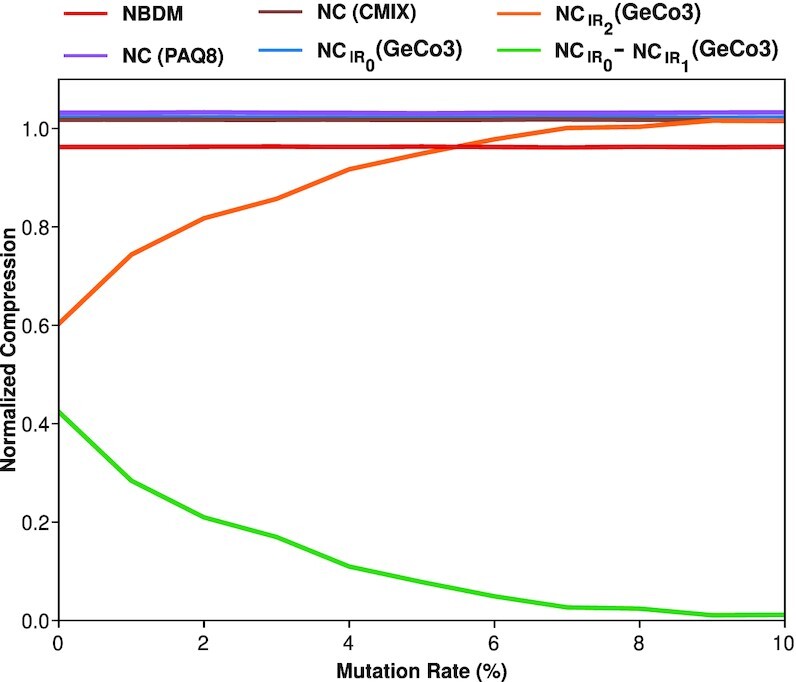
Figure 2.

: Plot describing the variation of normalized compression (NC) and normalized block decomposition method (NBDM) with an increase of mutation rate of a sequence (0–10%). The NC was computed using the state-of-the-art genomic compressor (GeCo3 [84]) and a general-purpose compressor (PAQ8 [104]). The NBDM (red line), the NC value using cmix (brown line), and PAQ8 (purple line) are depicted. Furthermore, the GeCo3 compressor with (IR2) and without (IR0) the IR detection subprogram is shown with orange and blue lines, respectively. Finally, the green line shows the difference between  .
.
