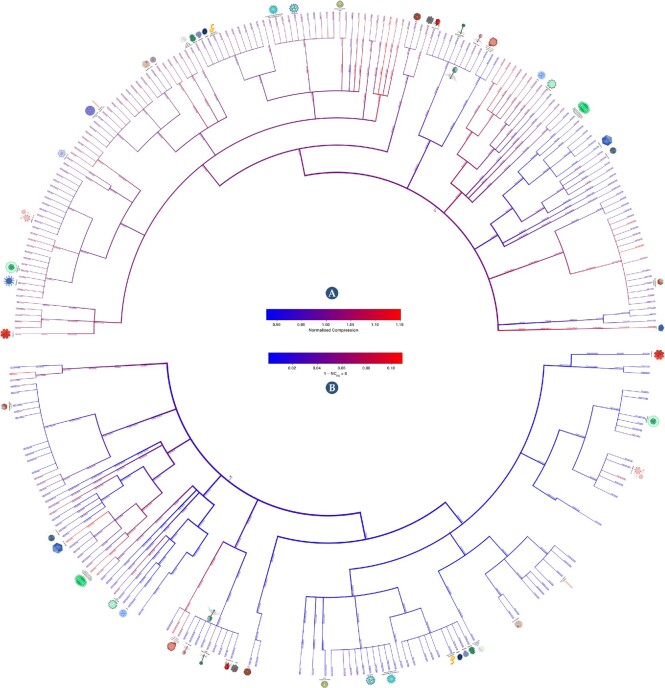
Figure 5.
: Cladograms showing average normalized compression (NC) of each viral group (A) and the normalized compression capacity (NCC) (B). NCC results were obtained by  . The red color depicts the highest complexity and the blue the lowest. The first cladogram describes the NC of each taxonomic branch. Red color shows genomes with less redundancy and blue ones with more redundancy. On the other hand, the second cladogram depicts the prevalence of inverted repeats on each taxonomic branch. Red indicates branches with genomes with a high percentage of inverted repeats, whereas blue shows branches with a low percentage. For better visualization, please visit the website https://asilab.github.io/canvas/.

