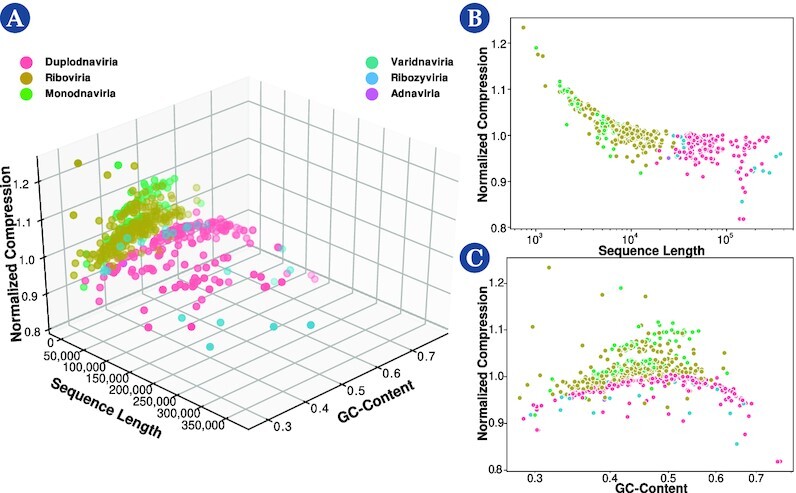
Figure 6.

: Scatterplots of normalized compression versus sequence length and GC-content (A), scatterplots of normalized compression versus sequence length (B), and normalized compression versus GC-content (C).

: Scatterplots of normalized compression versus sequence length and GC-content (A), scatterplots of normalized compression versus sequence length (B), and normalized compression versus GC-content (C).