Figure 3.
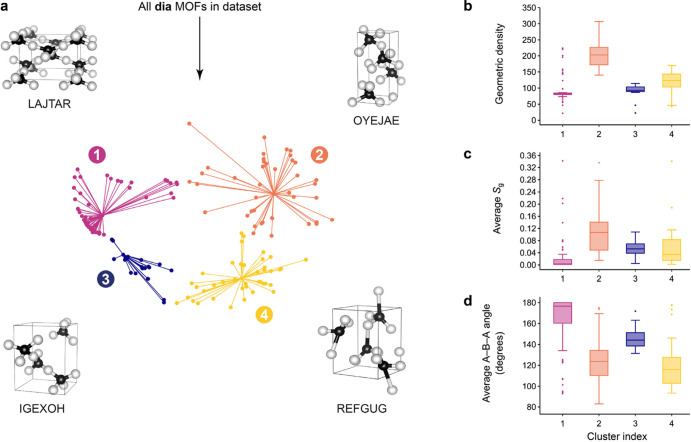
Geometric diversity within MOFs of dia topology. (a) From the data set characterized in Figure 2, we isolate the dia entries and analyze their distribution using a clustering algorithm, viz., affinity propagation.57 For each cluster, the algorithm selects an “examplar” datapoint, and the corresponding coarse-grained structures and their CSD refcodes are shown. Distributions of local properties for each cluster are presented on the right-hand side: (b) the geometric density, (c) the average angular component of the Chau–Hardwick order parameter, Sg, and (d) the average A−B−A angle. Throughout this paper, box plots are drawn such that boxes range from the 25th to the 75th percentile, with the median indicated by a horizontal line; whiskers span ±1.5 times the interquartile range, and points outside this range are plotted with circle markers.

