
Figure 1.
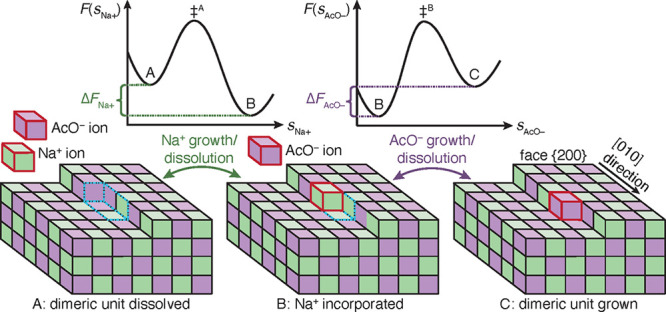
Schematic of the kink growth and dissolution process of an ion dimer for NaOAc polymorph I at surface {200} along edge [010]. Na+ and AcO– growth units are shown as green and purple cubes. State A shows a dissociated Na+ and AcO– (red frames) in solution and a crystal surface with a kink site; the dimeric unit, which is about to grow, is framed with dashed blue lines. In state B, the Na+ has grown at its kink site, while the AcO– ion’s kink site is still dissolved. In state C, both ions are incorporated into the fully crystalline dimeric unit. The growth process takes place as a sequence A → B → C, and the reverse sequence occurs for dissolution. Over each double sided arrow in the figure, indicating the growth and dissolution process of the ions, the corresponding schemes of the free energy surfaces, F, are shown. The F’s are functions of the crystallinity CVs of Na+ and AcO–, i.e. sNa+ and sAcO–, which describe the states A and B, as well as B and C. The transition states, ‡A and ‡B, indicate the ion’s growth and dissolution are activated processes. Because of the sequential growth and dissolution, the F’s are sampled in separate simulations for each ion at a given mole fraction, χ. The free energy difference of the dimeric unit is the sum ΔF = ΔFNa+ + ΔFAcO–. χ, where ΔF = 0, equates to the solubility.