

Abstract
Nonreactive surfactant molecules have long been used and characterized for a wide range of applications in industries, life science, and everyday life. Recently, new types of functional amphiphilic molecules have emerged that bear another function, for example, a light-absorbing action, or catalytic properties. However, the surfactant properties of these molecules remain to date essentially unknown. In this context, we investigated here the interfacial activity of photocatalytic surfactants based on a ruthenium(II) tris-bipyridine core, functionalized with two alkyl tails. We realized a systematic characterization of the surfactant properties of these molecules at a water–air interface and studied the effect of the alkyl chain length and of the counterions (hexafluorophosphate or chloride) on these properties. Our data demonstrate that ruthenium surfactants with chloride counteranions form a denser layer at the interface, but their surfactant properties can dramatically deteriorate when the chain length of the alkyl tail increases, leading to simple hydrophobic molecules with poor surfactant properties for the longest chains (C17). These findings pave the way for a better use and understanding of photocatalytic soft interfaces.
Introduction
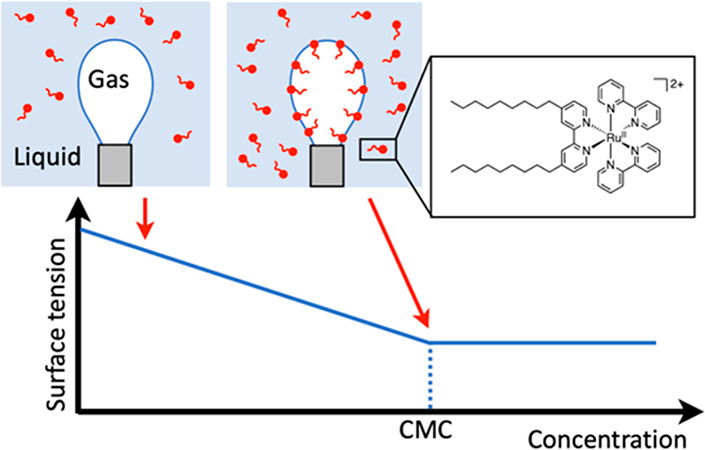
Surfactants are a class of amphiphilic molecules that combine a polar, hydrophilic head and one or several apolar, lipophilic tail(s). Due to their amphiphilic character, these molecules often self-assemble in aqueous solutions, where they may also modify the surface tension of water–oil and water–gas interfaces, with a wide range of applications as cleaning agents, additives for flotation or extraction,1 food additives,2 antibacterial or anticancer drugs, or formulation additives for drug delivery.3 Surfactants represent an incredibly rich class of molecules, some of which include a metal center in the polar head.4,5 Recently, new molecules of that type have been introduced where the metal head provides a catalytic or light-harvesting function. For example, amphiphiles with light-absorbing or catalytic properties have been prepared to realize photocatalytic water oxidation or CO2 reduction at soft interfaces, with a perspective to produce solar fuels.6,7 Initially, these molecules have been designed to support the different components of a photocatalytic system onto liposomes.6−12 More recently, they have also been considered for the building of photocatalytic soap films and monolayers, because the escape of O2, H2, or CO2-reduction products such as CO or CH4 is easier at a water–gas interface than inside a liquid.13
In photocatalytic liposomes or monolayers at water–gas interfaces, a photosensitizer is needed to capture the solar light energy and start a photocatalytic process. Although amphiphilic molecules based on porphyrin architectures have been known for a long time,14−16 the by far most used amphiphilic photosensitizers nowadays are those based on a ruthenium(II) tris-bipyridine core, typically functionalized with one or two alkyl tails. Ruthenium tris-bipyridine is a very powerful photosensitizer for photocatalysis because it combines a high excited state energy (2.05 eV), a long excited state lifetime (∼1 μs), and a high oxidation potential (1.28 V vs NHE).17 Due to these exceptional photosensitizing properties, it can be used to trigger both water photooxidation and CO2 or proton photoreduction. Though the influence of alkyl chain functionalization on the photochemical and photophysical properties of ruthenium tris-bipyridine derivatives is well understood, the reverse effect, i.e., the effect of the ruthenium tris-bipyridine head on the properties of the surfactant, remains to date unknown. Most of the reported works using amphiphilic ruthenium tris-bipyridine conjugates have made use of different alkyl chain lengths without apparent rationale.6,11,12 Some of us very recently demonstrated, however, that the alkyl chain length has significant influence on the supramolecular properties and assembly of these molecules in lipid membranes, with dramatic consequences on photocatalysis.7 This study suggests that the surfactant properties of such molecules may also depend significantly on the chain length. Finally, ruthenium tris-bipyridine is a bicationic complex that bears counteranions, typically chlorides or hexafluorophosphates. Generally speaking, the influence of the counteranions on the solubility of nonamphiphilic ruthenium polypyridyl complexes is known: due to their excellent solvation in aqueous solution, chloride anions enhance the water solubility of cationic ruthenium polypyridyl complexes, compared to hexafluorophosphates anions.17 However, the influence of the counteranion on the interfacial and self-assembling properties of amphiphilic ruthenium compounds remains largely unexplored.
In this work, we investigated the influence of, on one hand, the alkyl chain length, and on the other hand, the nature of the counteranion, on the surfactant properties of bis-alkylated ruthenium tris-bipyridine compounds. To do so, we synthesized a series of amphiphilic complexes [Ru(bpy)2(Cnbpy)](X)2 (hereafter called RuCn(X)2), where bpy is 2,2′-bipyridine, Cnbpy is a series of 4,4′-dialkyl-2,2′-bipyridine where n = 9, 12, 15, and 17 is the number of carbons of the alkyl chains, and the counteranion X– is either chloride Cl– or hexafluorophosphate PF6– (Figure 1). To understand the influence of the alkyl tail length on the ability of these molecules to modify the water–air interfacial properties, we performed different types of characterizations for both families of molecules: for the less soluble ones (PF6– counterions), we used a Langmuir trough, and for the more hydrophilic ones (Cl– counterions), we used a drop tensiometer (Figure 2). We characterized for the first time the compression isotherms and the adsorption kinetics of these compounds, which allowed us to characterize their area per molecule and to determine their surface pressure at the collapse, and the so-called interfacial Rosen parameters,18,19 which are commonly used to assess the performances of a surfactant. Based on our analysis, it was possible to identify which alkyl chain length and which counteranion lead to “real” surfactants, i.e., amphiphilic ruthenium molecules capable of modifying the water–air interface, as opposed to apparently amphiphilic molecules that are essentially hydrophobic and incapable of real surfactant behavior.
Figure 1.

Overview of the investigated amphiphiles RuCn(X)2; the positively charged Ru(bpy)22+ fragment is shown in black, and the color coding for the bipyridine ligand with different chain lengths corresponds to that used in other figures (blue for n = 9, green for n = 12, red for n = 15, and turquoise for n = 17). The counterion anion X– is either PF6– or Cl–.
Figure 2.

Principles of interfacial characterizations. (a) Scheme of a Langmuir–Blodgett trough. The surfactant layer is deposited on the subphase (blue molecules). The moving barriers compress the interfacial layer, and a force sensor measures the surface pressure. (b) Setup of the drop tensiometer: a gas (air) bubble is generated inside an aqueous solution, and its shape is observed via a camera. The interface lateral profile derives from the balance between surface tension and buoyancy, from which the surface tension value can be obtained.20
Experimental Section
Synthesis—General Methods
A Bruker AV300/1 FT-NMR spectrometer was used to record 1H NMR and 13C NMR as well as COSY, HSQC, and HMBC 2D spectra. Mestre Nova was used for the evaluation of the spectra. High-resolution mass spectrometry (HR-MS) was measured via direct injection on a mass spectrometer (Thermo Finnagan LTQ Orbitrap) with electrospray ionization. The ESI-MS mass spectra were measured with a ThermoFischer Scientific MSQ Plus electrospray ionization mass spectrometer with a 17–2000 m/z detection range and a resolution of approximately 0.5 m/z. Chromatographic silica columns were used for separating the components of the reaction mixtures, with a particle size of 40–63 μm and a surface area of 450–550 m2/g. The pore volume of the particles was 0.75–0.85 cm3/g. The silica powder was obtained from Screening Devices B.V. Dry loading was carried out by adsorbing the mixture onto either Celite or silica powder and solvent removal in vacuo, followed by deposition of the adsorbate on top of the column. The Celite was obtained from Sigma-Aldrich. To remove excess salts, size-exclusion chromatography (SEC) was performed using Sephadex LH-20 as a packing material and methanol as eluents. Sephadex LH-20 was purchased from VWR International B.V. Thin layer chromatography (TLC) was used as a first-hand method to test for the reaction mixtures’ compositions and the products’ purities. The TLC plates, composed of a fluorescent silica matrix with a pore volume of 0.75 cm3/g and a thickness of 0.2 mm, were supported on an aluminum sheet backing. The TLC plates were purchased from Supelco Analytical/Sigma-Aldrich. Elemental analysis was performed by Mikroanalytisches Laboratorium Kolbe in Oberhausen, Germany. The elemental content of the molecules was reported as the elements’ mass fraction percentage. Electronic absorption spectra were recorded on a Horiba Scientific Aqualog or on an Agilent Cary 50 Scan UV–vis spectrophotometer equipped with a single-cell Peltier temperature controller. Luminescence spectra were recorded on a Horiba Scientific Aqualog spectrophotometer equipped with a 150 W xenon lamp, an excitation range 230–620 nm, and an emission range 250–620 nm, using 3.5 mL 10 × 10 mm quartz cuvettes with four polished sides. Dynamic light scattering (DLS) was measured with a Zetasizer Nano-S from Malvern operating at 632.8 nm with a scattering angle of 173°. Structural data from single-crystal structures were retrieved from the Cambridge Crystal Structure Database,21 and distances between Ru atoms were analyzed with Mercury software.22
Melting points were measured on a Stuart melting point apparatus SMP30 with the temperature range of 20–400 °C. Temperature was increased from room temperature (RT) with an increase ramp of 2 °C/min in 0.4 °C increments until 180 °C and in 0.1 °C increments from 180 °C to the melting point.
All reagents for synthesis were commercially available. Dry and degassed solvents were purified by a solvent purification system. All reactions were carried out under an inert atmosphere, using standard Schlenk-techniques and N2 gas. Room temperature was typically between 20 and 25 °C. The synthesis of the ligands Cnbpy was adapted from a previous study.7,23 The ligand 4,4′-dinonyl-2,2′-bipyridine (C9bpy) and the precursor complex cis-[Ru(bpy)2Cl2] were purchased from Sigma-Aldrich. The synthesis of the water-insoluble compounds RuCn(PF6)2 is reported elsewhere.7 The melting points of RuC9(PF6)2, RuC12(PF6)2, RuC15(PF6)2, and RuC17(PF6)2 were 210, 210, 215, and 217 °C, respectively.
RuC9(Cl)2
A mixture of cis-[Ru(bpy)2Cl2] (152 mg, 0.314 mmol, 1.00 equiv) and 4,4′-dinonyl-2,2′-bipyridine (128 mg, 0.314 mmol, 1.00 equiv) in a 1:1 mixture of ethanol and water (20 mL) was degassed via N2 bubbling for 15 min and then heated at 110 °C for 2 days. The solvent was removed to dryness, and the remaining dry, red solid was triturated in acetone. Filtering and washing with acetone yielded the desired product as an orange powder (224 mg, 0.233 mmol, 74%). 1H NMR (400 MHz, MeOD): δ 8.72 (d, J = 8.2 Hz, 4H, bpy-3-CH, bpy-3′-CH), 8.64 (d, J = 1.9 Hz, 2H, C9bpy-3-CH, C9bpy-3′-CH), 8.13 (tt, J = 7.9, 1.6 Hz, 4H, bpy-4-CH, bpy-4′-CH), 7.87–7.77 (m, 4H, bpy-6-CH, bpy-6′-CH), 7.64 (d, J = 5.8 Hz, 2H, C9bpy-6-CH, C9bpy-6′-CH), 7.50 (dtd, J = 7.2, 5.7, 1.3 Hz, 4H, bpy-5-CH, bpy-5′-CH), 7.35 (dd, J = 5.8, 1.8 Hz, 2H, C9bpy-5-CH, C9bpy-5′-CH), 2.86 (t, 4H, α-CH2), 1.74 (p, J = 7.4 Hz, 4H, β-CH2), 1.47–1.16 (m, 24H, 12 × CH2), 0.88 (t, 6H, CH3). 13C NMR (101 MHz, MeOD): δ 158.64 (bpy-Cq), 158.60 (bpy-Cq), 158.20 (C17bpy-2-Cq, C9bpy-2′-Cq), 156.59 (C9bpy-4-Cq, C9bpy-4′-Cq), 152.64 (bpy-3-CH, bpy-3′-CH), 152.51 (C9bpy-6-CH, C9bpy-6′-CH), 151.86 (bpy-4-CH, bpy-4′-CH), 139.05 (bpy-5-CH, bpy-5′-CH), 128.96 (C9bpy-5-CH, C9bpy-5′-CH), 128.86 (bpy-5-CH, bpy-5′-CH), 125.71 (C9bpy-3-CH, C9bpy-3′-CH), 125.60 (bpy-3-CH, bpy-3′-CH), 36.26 (α-CH2), 33.02 (CH2), 31.38 (CH2), 30.59 (CH2), 30.46 (CH2), 30.44 (CH2), 30.40 (CH2), 23.73 (CH2), 14.44 (CH3). ESI-MS (MeOH) m/z (%): calcd for [C34H24N6O8Ru]2+, 411.2; found, 411.1. Anal. Calcd for C48H60Cl2N6Ru + 2H2O + 1CH3OH: C, 61.24; H, 7.13; N, 8.74. Found: C, 61.44; H, 6.87; N, 8.79. Melting point: 217 °C.
RuC12(Cl)2
A mixture of cis-[Ru(bpy)2Cl2] (0.20 g, 0.41 mmol, 1.00 equiv) and 4,4′-didodecyl-2,2′-bipyridine (0.20 g, 0.41 mmol, 1.00 equiv) was added to a deoxygenated water/ethanol/chloroform mixture (1:1:1, 30 mL) and refluxed under N2 for 3 days at 110 °C. The solvents were removed by rotary evaporation, and the crude product was chromatographed on silica gel eluting with first acetone followed by acetone/water/brine (8:4:1). After removal of the solvents by rotary evaporation, the solids were redissolved in water, extracted by chloroform, dried with MgSO4, and filtered. Evaporation of the chloroform yielded 185 mg of RuC12(Cl)2·2.5NaCl (71%, 0.189 mmol). Size-exclusion chromatography with methanol as eluents was performed to remove extra salts. 1H NMR (400 MHz, CD3OD): δ = 8.74 (dd, J = 8.1, 1.6 Hz, 4H, bpy-3-CH, bpy-3′-CH), 8.66 (d, J = 1.6 Hz, 2H, C12bpy-3-CH, C12bpy-3′-CH), 8.13 (tt, J = 8.1, 1.6 Hz, 4H, bpy-4-CH, bpy-4′-CH), 7.83 (dt, J = 5.7, 1.9 Hz, 4H, bpy-6-CH, bpy-6′-CH), 7.64 (d, J = 5.9 Hz, 2H, C12bpy-6-CH, C12bpy-6′-CH), 7.50 (dtd, J = 7.4, 5.9, 1.2 Hz, 4H, bpy-5-CH, bpy-5′-CH), 7.36 (dd, J = 5.9, 1.5 Hz, 2H, C12bpy-5-CH, C12bpy-5′-CH), 2.86 (t, J = 7.9 Hz, 4H, α-CH2), 1.74 (p, J = 7.8 Hz, 4H, β-CH2), 1.41–1.19 (m, 36H, 18 × CH2), 0.88 (t, J = 7.0 Hz, 6H). 13C NMR (101 MHz, CD3OD): δ = 158.60 (Cq), 158.57 (Cq), 158.16 (Cq), 156.53 (Cq), 152.62 (CH, bpy-6-CH), 152.49 (CH, bpy-6′-CH), 151.86 (CH, C12bpy-6-CH, C12bpy-6′-CH), 139.05 (CH, bpy-4-CH, bpy-4′-CH), 128.97 + 128.87 (CH, C12bpy-5-CH, C12bpy-5′-CH, bpy-5-CH, bpy-5′-CH), 125.74 + 125.63 (CH, C12bpy-3-CH, C12bpy-3′-CH, bpy-3-CH, bpy-3′-CH), 36.24 (α-CH2), 33.05 (CH2), 31.36 (CH2), 30.75 (CH2), 30.72 (CH2), 30.62 (CH2), 30.46 (CH2), 30.45 (CH2), 30.43 (CH2), 23.72 (CH2), 14.46 (CH3). HR-MS m/z: calcd for [C54H72N6Ru]2+, 453.243 28; found, 453.242 72. Anal. Calcd for C54H72N6Cl2Ru·2.5 NaCl: C, 57.74; H, 6.46; N, 7.48. Found: C, 58.04; H, 6.51; N, 7.51. Anal. Calcd for C54H72N6Cl2Ru + 0.5 H2O (after size-exclusion chromatography): C, 65.77; H, 7.46; N, 8.52. Found: C, 65.95; H, 7.37; N, 8.49. Melting point: 217 °C.
RuC15(Cl)2
A mixture of cis-[Ru(bpy)2Cl2] (0.21 g, 0.43 mmol, 1.00 equiv) and 4,4′-dipentadecyl-2,2′-bipyridine (0.25 g, 0.43 mmol, 1.00 equiv) was added to a deoxygenated water/ethanol/chloroform mixture (1:1:1, 30 mL) and refluxed under N2 for 4 days at 110 °C. The solvents were removed by rotary evaporation, and the crude product was chromatographed on silica gel eluting with acetone/water/brine (8:4:1). After removal of the solvents by rotary evaporation, the solids were redissolved in chloroform, and the white precipitates were filtered off. This process was repeated with methanol as the solvent to yield 258 mg of RuC15(Cl)2·xNaCl. To remove excess salt, the red solid was purified by size-exclusion chromatography using methanol as eluents. Rf = 0.1 [SiO2, acetone/water/brine (8:4:1)]. 1H NMR (400 MHz, CD3OD): δ = 8.73 (d, J = 8.2 Hz, 4H, bpy-3-CH, bpy-3′-CH), 8.64 (d, J = 1.9 Hz, 2H, C15bpy-3-CH, C15bpy-3′-CH), 8.13 (tt, J = 8.0, 1.5 Hz, 4H, bpy-4-CH, bpy-4′-CH), 7.82 (td, J = 5.7, 1.8 Hz, 4H, bpy-6-CH, bpy-6′-CH), 7.64 (d, J = 5.8 Hz, 2H, C15bpy-6-CH, C15bpy-6′-CH), 7.50 (dq, J = 7.0, 5.5, 1.3 Hz, 4H, bpy-5-CH, bpy-5′-CH), 7.35 (dd, J = 5.9, 1.7 Hz, 2H, C15bpy-5-CH, C15bpy-5′-CH), 2.85 (t, J = 7.8 Hz, 4H, α-CH2), 1.74 (q., J = 8.0 Hz, 4H, β-CH2), 1.28 (m, 48H, 24 × CH2), 0.89 (t, J = 6.6 Hz, 6H, CH3). 13C NMR (101 MHz, CD3OD): δ = 158.62 (Cq), 158.58 (Cq), 158.17 (Cq), 156.55 (Cq), 152.63 (CH, bpy-6-CH), 152.49 (CH, bpy-6′-CH), 151.87 (CH, C15bpy-6-CH, C15bpy-6′-CH), 139.05 (CH, bpy-4-CH, bpy-4′-CH), 128.87 (CH, C15bpy-5-CH, C15bpy-5′-CH, bpy-5-CH, bpy-5′-CH), 125.62 (CH, C15bpy-3-CH, C15bpy-3′-CH, bpy-3-CH, bpy-3′-CH), 36.24 (α-CH2), 33.07 (CH2), 31.35 (CH2), 30.79 (CH2), 30.75 (CH2), 30.72 (CH2), 30.61 (CH2), 30.47 (CH2), 30.44 (CH2), 30.41 (CH2), 23.74 (CH2), 14.46 (CH3). HR-MS m/z calculated for [C60H84N6Ru]2+: 495.290 32, found: 495.290 07. Anal. Calcd for C60H84N6Cl2Ru·xNaCl: C, 67.90; H, 7.98; N, 7.92. Found: C, 44.76; H, 7.40; N, 5.12. Anal. Calcd for C60H84N6Cl2Ru + 1 H2O (after size-exclusion chromatography): C, 66.77; H, 8.03; N, 7.79. Found: C, 66.98; H, 8.12; N, 7.79. Melting point: 223 °C.
RuC17(Cl)2
A mixture of cis-[Ru(bpy)2Cl2] (754 mg, 1.56 mmol, 1.00 equiv) and 4,4′-diheptadecyl-2,2′-bipyridine (978 mg, 1.54 mmol, 0.99 equiv) in a 1:1:1 mixture of ethanol, water, and chloroform (60 mL) was degassed via N2 bubbling for 15 min and then heated at 110 °C for 2 days. After cooling to room temperature, the solvent was removed in vacuo. The reaction mixture was subjected to column chromatography (SiO2, acetone → 8:4:1 acetone/water/brine → 100:10:1 acetone/water/sat. KNO3[aq]) to isolate the red-orange fraction. The organic solvent was removed in vacuo, and the red compound was extracted with chloroform (3×). The combined organic layers were dried with MgSO4, and the solvent was removed to dryness. The red solid was taken up in methanol and subjected to an ion exchange column with Amberlite (50 g, presoaked with brine and washed 10 times with water and 3 times with methanol). The solvent was removed, and the red solid was taken up in a mixture of chloroform and 1:1 water/brine. The phases were separated, and the aqueous phase was extracted with chloroform (2×). The combined organic layers were dried with MgSO4, and the solvent was evaporated in vacuo. Trituration of the solid in acetone (100 mL) followed by removal of 50 mL of acetone at the rotary evaporator, cooling to room temperature, filtration, and washing with acetone (50 mL) yielded the desired compound as a chloride salt: RuC17(Cl)2·NaCl·3H2O) (1.14 g, 0.927 mmol, 60%). Size-exclusion chromatography with methanol as eluents was performed to remove extra salts. 1H NMR (400 MHz, MeOD): δ 8.67 (d, J = 8.2 Hz, 4H, bpy-3-CH, bpy-3′-CH), 8.59 (d, J = 1.9 Hz, 2H, C17bpy-3-CH, C17bpy-3′-CH), 8.15–8.03 (m, 4H, bpy-4-CH, bpy-4′-CH), 7.88–7.67 (m, 4H, bpy-6-CH, bpy-6′-CH), 7.61 (d, J = 5.8 Hz, 2H, C17bpy-6-CH, C17bpy-6′-CH), 7.46 (dtd, J = 7.2, 5.7, 1.3 Hz, 4H, bpy-5-CH, bpy-5′-CH), 7.31 (dd, J = 5.9, 1.8 Hz, 2H, C17bpy-5-CH, C17bpy-5′-CH), 2.82 (t, J = 7.9 Hz, 4H, α-CH2), 1.71 (p, J = 7.3 Hz, 4H, β-CH2), 1.44–1.11 (m, 56H, CH2), 0.87 (t, J = 6.6 Hz, 6H, CH3). 13C NMR (101 MHz, MeOD): δ 158.63 (bpy-Cq), 158.60 (bpy-Cq), 158.19 (C17bpy-2-Cq, C17bpy-2′-Cq), 156.56 (C17bpy-4-Cq, C17bpy-4′-Cq), 152.65 (bpy-6-CH), 152.52 (bpy-6′-CH), 151.87 (C17bpy-6-CH, C17bpy-6′-CH), 139.01 (bpy-4-CH, bpy-4′-CH), 128.95 (C17bpy-5-CH, C17bpy-5′-CH), 128.84 (bpy-5-CH, bpy-5′-CH), 125.67 (C17bpy-3-CH, C17bpy-3′-CH), 125.49 (bpy-3-CH, bpy-3′-CH), 36.26 (α-CH2), 33.09 (CH2), 31.35 (CH2), 30.80 (CH2), 30.77 (CH2), 30.74 (CH2), 30.63 (CH2), 30.49 (CH2), 30.44 (CH2), 30.42 (CH2), 23.75 (CH2), 14.47 (CH3). ESI-MS (MeOH) m/z: calcd for [C64H92N6Ru]2+, 523.32; found, 523.0. Anal. Calcd for C64H92Cl2N6Ru·NaCl·3H2O: C, 62.50; H, 8.03; N, 6.83. Found: C, 62.63; H, 8.03; N, 6.70. Anal. Calcd for C64H92Cl2N6Ru (after size-exclusion chromatography): C, 68.79; H, 8.30; N, 7.52. Found: C, 68.54; H, 8.55; N, 7.59. UV–vis λmax, nm (ε in M–1 cm–1): 453 (1.69 × 10⁴) in CH3CN. Emission, λmax: 615 nm in CH3CN. Melting point: 218 °C.
Interfacial Characterization of the Compounds with PF6– Counterions
To probe the interfacial properties of the non-water-soluble RuCn(PF6)2 compounds, Langmuir–Blodgett (LB) trough experiments were performed at room temperature (between 20 and 25 °C) using a commercial instrument (NIMA 601M). LB experiments consist in depositing a surface-active compound on a subphase (here, water) and compressing the deposited layer using two controlled moving barriers placed at the liquid–gas interface24 (Figure 2a). The surface pressure for different compressions is measured thanks to a vertical paper plunged in the solution and attached to a force sensor. In practice, solutions of RuCn(PF6)2 with n = 9, 12, 15, and 17 at 1 g/L in chloroform (HPLC grade, assay >99.8%) were prepared. The first step consisted in filling the trough with 50 mL of distilled water and depositing droplets of the solution under study on the distilled water bath. During this first step, the barriers of the trough were completely open, and the surface area of the air–water interface was 84 cm2. The deposited solution was uniformly distributed on the air–water interface, and its total volume was between 5 and 10 μL. We checked that the precise deposited volume has a negligible influence on the measurements (Figure S1). After 10 min, necessary for the evaporation of the chloroform, the newly created RuCn(PF6)2 monolayer at the air–water interface was compressed, while the surface pressure Π was measured. The latter corresponds to the reduction of the surface tension and is defined as Π = γ0 – γ with γ and γ0 being the surface tension and the initial surface tension of the interface, respectively. For all of the experiments, the area between the barriers was decreased from 84 to 22 cm2 at a speed of 10 cm2/min. For each RuCn(PF6)2 compound, two consecutive compression–decompression cycles were performed to check if the monolayer underwent an irreversible transformation such as the desorption of molecules from the air–water interface or an irreversible reorganization of the molecules at the interface, which typically manifests in qualitative differences between the first and second cycle. The experiments were performed in the dark to avoid the exposure of the photoactive RuCn(PF6)2 compounds to light.
Interfacial Characterization of the Compounds with Cl– Counterions
Solutions of RuCn(Cl)2 with n = 9, 12, 15, and 17 in demineralized water (by Mieuxa) were prepared at different concentrations and stirred for a few hours (up to 4 h) to solubilize the photosensitizers. For RuC17(Cl)2, which is more hydrophobic and hence less water-soluble, the complete solubilization of the compound required heating the samples for 1 h at 50 °C. The samples were left to cool down at room temperature (between 20 and 25 °C) before their use. According to DLS measurements, this procedure dissolved all aggregates of RuC17(Cl)2 in solution at 1 mg/mL corresponding to around 0.9 mmol/L (Figures S2 and S3). No precipitation of the RuC17(Cl)2 compound was observed during the months following the heating procedure. In addition, we checked that the heating step did not modify our results for the more soluble compound RuC12(Cl)2: heated and nonheated samples showed the same interfacial behavior (Figure 5).
Figure 5.

Plot of the equilibrium surface tension vs the concentration of RuCn(Cl)2 compounds with n = 9, 12, and 15 (dots). All plots include the fitting with the Volmer model (gray line) and the estimation of critical micellar concentration (arrow, deduced from the intersection of the dashed lines). For n = 12, we also show data obtained for heated samples (hollow diamonds).
The interfacial properties of each compound at the air–water interface were then probed using an automatic drop tensiometer (Tracker by Teclis,20 see Figure 2b). This technique, known as “the pendant drop” method, consists in creating a millimetric rising gas bubble in an aqueous solution of the surfactant under study using a computer-controlled syringe. The self-assembly of the surfactant at the created gas–water interface modifies the surface tension of the interface, which—in combination with Archimedes’ force—pushes the bubble to the top, directly influencing the shape of the air bubble. By extracting the profile of the bubble using a camera and fitting the theoretical Young–Laplace equation to the experimental bubble profile, the value of the surface tension is determined. These experiments can also be performed as a function of time.20
Similarly to the LB experiments, precautions were taken to avoid the exposure of the RuCn(Cl)2 compounds to light: the solutions were stored in the dark, and the automatic drop tensiometer was modified by the addition of a high pass filter (630 nm) to the white light source, and an opaque tubing between the sample and the camera was added.
For the current study, the experiments for RuCn(Cl)2 with n = 9, 12, and 15 consisted in generating a rising air bubble in a RuCn(Cl)2 solution at a given concentration and monitoring the value of the surface tension at the air–water interface during 14 h or until an equilibrium value was reached. During these experiments, air bubbles were subjected to low-amplitude sinusoidal variations of their volume to characterize the viscoelastic response of the interfaces (see the SI). For RuC17(Cl)2, experiments at concentrations below 2.4 mmol/L were performed following the protocol described above. For higher concentrations, the experiments consisted in generating a pendant drop of the RuC17(Cl)2 solution in demineralized water at the tip of a capillary in an air environment. Similarly, the evolution of surface tension at the air–water interface was monitored for up to 14 h. Despite being slightly sensitive to disruptions and evaporation, this technique was used for high concentrations, because it required a smaller volume of the solution and hence less compound. All of experiments were performed at room temperature (between 20 and 25 °C) for which the surface tension of pure water is γ0 = 72.3 mN/m. Note that 14 h might not be long enough to reach dynamical equilibrium, especially for the most hydrophobic complexes as described in the Results and Discussion section.
Results and Discussion
Compounds with Hexafluorophosphate Counteranions
The RuCn(PF6)2 compounds have a low water solubility, which made tensiometer measurements impossible. To characterize their monolayers at the air–water interface, Langmuir–Blodgett (LB) experiments were hence performed, as described in the Experimental Section and Figure 2a. The experimental surface pressure isotherms of all RuCn(PF6)2 compounds are presented in Figure 3. In contrast to RuC9(PF6)2, the more hydrophobic complexes RuC12(PF6)2, RuC15(PF6)2, and RuC17(PF6)2 underwent a collapse at high surface pressure (low surface tension) indicated by a plateau at the end of the compression phase. Langmuir monolayers undergo multiple phase changes during a compression (gaseous, liquid expanded, liquid condensed, and solid); here, the monolayer transitioned from a gaseous/liquid expanded phase (surface pressure values around zero) to a condensed state. The collapse occurred when the area per molecule reached a limiting value beyond which the monolayer cannot be compressed further without destabilizing its 2D nature and yielding structures in the third dimension, thereby leading to a slope change.25 The average values of the area per molecule, the surface pressure, and the tension at the collapse are reported in Table 1. RuC9(PF6)2 did not collapse, as observed by the missing plateau at low area per molecule. However, RuC9(PF6)2 showed lower pressure values during a second compression cycle (see the inset of Figure 3). This result suggests that the monolayer underwent an irreversible transformation during the first compression, even if a plateau was not observed. We hypothesize that desorption of RuC9(PF6)2 molecules from the interface into the bulk water phase occurred, which is compatible with the experimental observation that this short-tailed compound is slightly water-soluble. For n = 12, 15, and 17, the molecules are hydrophobic enough to remain at the interface during the compression of the monolayer; i.e., they behave as nonsoluble in water in the experimental conditions explored with the Langmuir trough. Furthermore, the surface pressure at the collapse (Πcol) clearly increased with the length of the alkyl chain, ranging from 34.1 mN/m for RuC12(PF6)2 to 45.4 mN/m for RuC17(PF6)2 (Figure 3). This trend can be attributed to the increase of the hydrophobicity of these compounds with the length of the alkyl chain. Very hydrophobic molecules are more likely to remain at the air–water interface during compression, which would allow high surface pressure values to be reached.26
Figure 3.

Surface pressure vs area per molecule upon compression of RuCn(PF6)2 monolayers during LB experiments. The legend shows the color coding for different n values. Lines correspond to fits with the modified Volmer model (eq 2 and Table 1). The inset shows a shift during the first two cycles for n = 9. The stars highlight the monolayer collapse.
Table 1. LB Experiments for RuCn(PF6)2: Monolayer Properties at the Collapse (Average Values) and Parameter Fits for the Modified Volmer Model (Data of Figure 3).
| monolayer properties at the collapse |
parameter fits for the modified Volmer model |
||||||
|---|---|---|---|---|---|---|---|
| n (chain length) | surface pressure Πcol (mN/m) | surface tension γcola (mN/m) | area per molecule Acol (Å2) | α0 (Å2) | ε (m/N) | Π* (mN/m) | standard error of the estimate (Å2) |
| 9 | 97 | 6.7 | 9.0 | 0.55 | |||
| 12 | 34.1 ± 0.4 | 38.2 ± 0.4 | 104 ± 1 | 140 | 8.3 | 6.1 | 1.35 |
| 15 | 41.3 ± 0.5 | 31.0 ± 0.5 | 98 ± 4 | 180 | 12 | 5.2 | 0.71 |
| 17 | 45 ± 1 | 27.3 ± 1 | 118 ± 2 | 160 | 6.3 | 6.2 | 1.27 |
γ = γ0 – Π with γ0 = 72.3 mN/m
To further characterize the RuCn(PF6)2 monolayers at the air–water interface, the compression isotherms in the condensed state27 were fitted with a modified Volmer model that considers the molecules as hard disks with no long-range interactions and includes the expression of the two-dimensional monolayer compressibility coefficient ε (m/N).28−30 In this model, the excluded area per molecule α decreases when the surface pressure increases as described by the following equation:
| 1 |
with α0 (m2) being the excluded area per molecule in the gaseous/liquid expanded phase27 and Π (N/m) the surface pressure in the monolayer. In such a model, the modified Volmer equation can be written as follows:
| 2 |
where kB = 1.38 × 10⁻²³ J/K corresponds to the Boltzmann constant, T to the absolute temperature (K), A (m2) to the available area per molecule in the monolayer, and Π* to the cohesion pressure (N/m) accounting for the intermolecular interactions in the gaseous state (i.e., in the limit of low Π). Equation 2 provides an explicit expression for the area per molecule A(Π). Figure 3 shows that the experimental compression isotherms are well described by eq 2, at least for n = 12, 15, and 17; the corresponding fitting parameters are summarized in Table 1. As discussed previously, the compression isotherm for n = 9 suggests that a fraction of the molecules initially present in the monolayer desorbed during the applied compression; this desorption is likely at the origin of the deviation between the experimental data and eq 2 at high surface pressure values (Π > 18 mN/m).
According to this model, the area per molecule at the onset of the collapse, Acol, did not vary significantly with the alkyl chain length, with an average value around 107 Å2 per molecule. If the tails are oriented perpendicular to the interface, the area per molecule at the collapse is a signature of the headgroup size, which is approximately the same for all investigated RuCn2+ molecules. Using the approximation of spherical headgroups organized in a hexagonal close packing, this Acol value translates into an average diameter of 11 Å for each headgroup, which includes their associated counterions and solvent molecules. This size is comparable with the intermolecular Ru···Ru distances in published solid state crystal structures of RuC0(PF6)2 compounds (CCDC 101676, 1115194, 1914096, 1115193, 101675, 1852899, and 1115195 with minimal Ru···Ru distances of d = 8.15–13.3 Å),21 which indicates a dominant influence of the headgroup–PF6– ion pair on the average diameter per molecule and Acol at the water–air interface. We therefore conclude that the character and geometry of the contact ion pair of the ruthenium centered headgroup and the PF6– counterions are similar at the air–water interface as in the single-crystalline solid state. The fitted values of α0, ε, and Π* did not vary appreciably with the tail length n (between 12 and 17), while it plays a crucial role in tuning the hydrophobicity of the RuCn(PF6)2 molecules. Similarly to Acol, the average values of α0, ε, and Π* are probably a result of the properties of the headgroup, which is the same for all compounds. Finally, for n > 9, the excluded area per molecule α0, which corresponds to collapse for noncompressible monolayers, was larger than the area per molecule at the collapse Acol, which confirmed the compressibility of these monolayers.
Compounds with Chloride Counteranions
Qualitatively, the RuCn(Cl)2 compounds were found much more soluble than their hexafluorophosphate analogues, and at the highest concentrations used for this study, i.e., 5.6 × 10⁻⁴, 10–4, and 5.6 × 10⁻⁵ mol/L, for n = 9, n = 12, and n = 15, respectively, no aggregates nor precipitates were observed. The higher water solubility of the RuCn(Cl)2 compounds allowed their study using a drop tensiometer (Figure 2b), as described in the Experimental Section. By varying bulk concentrations of RuCn(Cl)2 in the solution, time-dependent surface tension measurements showed that these molecules decreased the value of surface tension over time, which is a strong indication that they indeed act as surfactants by adsorbing at the air–solution interface (Figure 4).
Figure 4.

Surface tension γ as a function of time t for RuCn(Cl)2 samples obtained at various chain lengths and concentrations. The solid lines correspond to the Ward and Tordai equation in the short time approximation (eq 4) fitted to the experimental data for γ ≳ 65 mN/m. For clarity, the experimental data are shown as averaged over logarithmically spaced windows.
To model these time-dependent data, the adsorption of surfactant molecules to the air–water interface can be seen as a two-step process.31,32 First, the molecules diffuse from the bulk to the interface due to the concentration gradient. Second, adsorption makes surfactant molecules migrate from the subsurface to the surface itself. If the rate of diffusion is much slower than that of adsorption, the whole process is controlled by diffusion. In this limit, Ward and Tordai integrated the diffusion equation and obtained the following equation:33
| 3 |
where t (s) is the time, Γ(t) (m–2) is the surface excess (it corresponds to the inverse of the area per molecule A considered in Figure 3), NA = 6 × 10²³ mol–1 is the Avogadro number, Cb (mol/m3) is the bulk molar concentration, DT (m2/s) is the diffusion coefficient, Cs(τ) (mol/m3) is the subsurface concentration, and τ (s) is a variable of integration. If a surface-active monolayer behaves as an ideal surface at short times, an approximation can be obtained using the Henry adsorption isotherm for ionic surfactants γ0 – γ(t) = 2kBTΓ(t), which relates surface pressure to surface excess.34 We obtain a simple expression for the time dependence of the initial surface tension decrease at short times (eq 4):
| 4 |
where R = NAkB is the molar gas constant. In practice, the apparent diffusion coefficient DT of each RuCn(Cl)2 compound was obtained by fitting eq 4 to the adsorption curves γ(t) at the initial stage of adsorption (solid lines in Figure 4). This initial stage is defined here as γ ≳ 68 mN/m (γ0 – γ(t) ≲ 5 mN/m). The fitted diffusion coefficients for the different chain lengths and concentrations are reported in Table 2.
Table 2. Apparent Diffusion Coefficients DT Deduced from the Adsorption Curves (Figure 4) at Various Tail Lengths and Concentrations of RuCn(Cl)2.
| chain length n | C (μmol/L) | DT (m2/s) | DT/DSE | limiting kinetics |
|---|---|---|---|---|
| 9 | 23 | 1.7 × 10⁻¹⁰ | 0.4 | diffusion |
| 12 | 10 | 8.4 × 10⁻¹¹ | 0.2 | diffusion |
| 31 | 2.4 × 10⁻¹¹ | 0.06 | adsorption | |
| 31 | 3.7 × 10⁻¹² | 0.009 | adsorption | |
| 15 | 9.3 | 1.1 × 10⁻¹⁰ | 0.3 | diffusion |
| 56 | 3.1 × 10⁻¹³ | 8 × 10⁻⁴ | adsorption | |
| 17 | 240 | 4.9 × 10⁻¹⁶ | 1 × 10⁻⁶ | adsorption |
| 1600 | 1.4 × 10⁻¹⁷ | 4 × 10⁻⁸ | adsorption |
These values should be compared to other estimations of the diffusion coefficient. For instance, the Stokes–Einstein equation35 can be used to calculate the Stokes–Einstein diffusion coefficients DSE of RuCn(Cl)2 (eq 4), assuming that these molecules are spherical particles:
| 5 |
where kB = 1.38 × 10⁻²³ J/K is the Boltzmann constant, T (K) is the absolute temperature, η (Pa s) is the dynamic viscosity of the solution containing the particle (water in our case), and r = 5.5 Å is the radius of the ruthenium head. With T = 293 K and η = 1.0016 mPa s, we find DSE = 3.9 × 10⁻¹⁰ m2/s. This value is similar to the diffusion coefficient reported for the nonionic surfactant Triton-X-100 (2.9 × 10⁻¹⁰ m2/s) or the cationic surfactants C14TAB and C16TAB (4 × 10⁻¹⁰ m2/s).36,37 When DT is comparable to DSE, this indicates that the kinetics are limited by diffusion, while DT ≪ DSE indicates the existence of an adsorption energy barrier (adsorption slower than diffusion). The last two columns of Table 2 show that the adsorption kinetics move from diffusion-limited to sorption-limited when the chain length n increases and when the concentration increases. This is consistent with literature results obtained for other cationic surfactants,38,39 although the adsorption time scales are much longer in our case. Indeed, for n = 17, this very slow adsorption implies that an equilibrium surface tension is never reached in our experiments that typically last 10–15 h. This shows the limited surfactant properties of the C17 compound. However, for n = 9, 12, and 15, equilibrium is reached after at most a few hours.
The surface tension values obtained at the equilibrium for different compound concentrations are thus shown in Figure 5 for n = 9, 12, and 15. Equilibrium surface tension values first dropped with increasing concentration but became constant above a critical bulk concentration. This behavior is commonly observed for surface-active molecules when colloidal clusters, called micelles, are formed.40 Any surfactant molecule added after this point will go into the bulk and aggregate into micelles. The so-called critical micelle concentration (CMC) values are shown by an arrow in Figure 5 and are reported in Table 3. From these curves, one can evaluate the Rosen parameters, which are typically used to quantitatively assess the performances of a surfactant.18,19 The Rosen parameters of RuCn(Cl)2 compounds are defined as follows:
The CMC value is the concentration at which surface-active molecules start forming micelles in polar solvents. In practice, micelle formation induces a break in the evolution of the equilibrium surface tension vs bulk concentration. These CMC values were determined by fitting the experimental data of Figure 5 before and after the slope change using logarithmic regressions. The CMC values of RuCn(Cl)2 compounds obtained from tensiometry experiments range between 2.9 and 320 μmol/L and depend strongly on the alkyl chain length, though no clear trend is observed. These values are lower by more than 1 order of magnitude than the CMC of common ionic surfactants (sodium dodecyl sulfate or SDS, cetyltrimethylammonium bromide or CTAB, 1–10 mM) but similar to one of the nonionic ones (hexaethylene glycol monododecyl ether or C12E6, 75 μM).13,41,42 This could be explained by the size of the molecules that tends to decrease the CMC. The effect of the hydrophobic chain length is more complex to interpret. Whereas the CMC is known to decrease with the alkyl chain length [as observed for the difference between RuC9(Cl)2 and RuC15(Cl)2],41−43 some specific packing and configuration emerges if the number of carbon is an odd or an even number.44,45 This may explain the higher CMC measured for n = 12, compared to n = 9 and 15. A similar behavior has indeed already been reported for other cationic surfactants.46
The C20 value is the bulk concentration necessary to reduce the surface tension at the air–solvent interface by 20 mN/m.19 This parameter can be interpreted as the true efficiency of a molecule as a surfactant, as it characterizes its ability to adsorb at the interface. C20 values for RuCn(Cl)2 compounds are reported in Table 3. These values were strongly alkyl-chain dependent and followed more or less the CMC values (hence, with no clear trend).
The γmin parameter is the minimum value of surface tension reached in the surface tension measurement.18 It can be interpreted as the effectiveness of a surfactant, as it characterizes here its ability to reduce the surface tension, regardless of its concentration. The γmin values for RuCn(Cl)2 ranged between 30 and 40 mN/m and increased with the chain length for n = 9, 12, and 15 (Table 3, Figure 5). In addition, these values are in the same order of magnitude as commonly used surfactants such as SDS or alkyltrimethylammonium bromide at the air–water interface.18,41
Table 3. List of the Surface-Related Parameters of All RuCn(Cl)2 Compounds.
| Rosen parameters |
parameter fits for Volmer model |
|||||||
|---|---|---|---|---|---|---|---|---|
| n | molecular mass from elemental analysis (g/mol) | CMC (μmol/L) | γmin (mN/m) | C20 (μmol/L) | 1/K (μmol/L) | α (Å2) | area/molecule at the CMC (Å2) | standard error of the estimate |
| 9 | 961.09 | 41 | 29 | 5.0 | 2.3 | 19 | 28 | 0.14 |
| 12 | 977.18 | 320 | 43 | 31 | 0.010 | 120 | 230 | 0.74 |
| 15 | 1079.36 | 2.9 | 44 | 0.93 | 0.23 | 27 | 51 | 0.29 |
| 17 | 1117.45 | n.d.a | n.d. | n.d.a | n.d.a | 22b | n.d.a | n.d.a |
n.d.: not determined.
This value has been deduced from the interfacial viscoelasticity data (see Figure S4 and the Supporting Information).
In terms of these Rosen parameters, RuC9(Cl)2 appeared as the most effective surfactant of the series, as it allowed reaching the smallest surface tension value, but RuC15(Cl)2 was the most efficient, because its CMC and C20 values are extremely low.
To further characterize the absorbed RuCn(Cl)2 monolayers at the air–water interface, we fitted our experimental data with the Volmer model for adsorption isotherms.47 Assuming a monomolecular adsorption, an adsorption isotherm relates the surfactant concentration in the bulk to the adsorbed amount at the interface. The Volmer model is derived assuming a finite molecular size, a nonlocalized adsorption, and only hard-core interactions between the adsorbed surfactants. For simplicity, we neglect the compressibility of the surfactant monolayer and the cohesion pressure considered for the insoluble PF6 compounds. The equation of state and the adsorption isotherm are given by eqs 6 and 7:
| 6 |
| 7 |
where Π = γ0 –
γ is the surface pressure (N/m), γ0 the initial
surface tension of the interface, K an adsorption
constant (L/mol), Γ the surfactant adsorption (m–2), α (m2) the excluded area, T the
absolute temperature (K), kB = 1.38 × 10⁻²³ J/K the Boltzmann constant, and C the surfactant
bulk concentration (mol/L). Equations 6 and 7 yield explicitly the bulk
concentration C as a function of surface tension
γ. We therefore fitted the experimental data C(γ) of Figure 5 using the Volmer model to deduce the best K and
α values (reported in Table 3). As the concentration data are shown with a logarithmic
scale, we fitted the logarithm values of the concentrations. The merit
of the fit is thus characterized by the standard error of the estimate
defined as  where N is the number
of fitted data points. This model provides a good description of the
experimental data as observed in Figure 5. The agreement is confirmed by looking at
the viscoelastic properties of the interfaces (see the SI). The viscoelastic measurements also allowed
us to estimate α for the C17 compound which did not reach equilibrium.
Overall, we find that the excluded area α for the odd number
of carbons (n = 9, 15, and 17), around 23 ±
4 Å2 (d = 5.4 ± 0.5 Å),
is smaller than the Ru···Ru intermolecular distances
found in published solid state crystal structures of Ru(bpy)32+ with halide counterions, ranging between d = 7.5 and 7.8 Å (CCDC 1042836).48
where N is the number
of fitted data points. This model provides a good description of the
experimental data as observed in Figure 5. The agreement is confirmed by looking at
the viscoelastic properties of the interfaces (see the SI). The viscoelastic measurements also allowed
us to estimate α for the C17 compound which did not reach equilibrium.
Overall, we find that the excluded area α for the odd number
of carbons (n = 9, 15, and 17), around 23 ±
4 Å2 (d = 5.4 ± 0.5 Å),
is smaller than the Ru···Ru intermolecular distances
found in published solid state crystal structures of Ru(bpy)32+ with halide counterions, ranging between d = 7.5 and 7.8 Å (CCDC 1042836).48
Comparison between Hexafluorophosphate and Chloride Counterions
A comparison of the excluded area per molecule for the RuCn(Cl)2 compounds (α) to the area per molecule at the collapse for the RuCn(PF6)2 compounds (Acol) is reported in Figure 6a. It shows that the compounds with chloride counterions would take up less area at the interface at full surface saturation. Even the area per molecule values at the CMC for the RuCn(Cl)2 compounds (estimated in Table 3) are smaller than the area per molecule at the collapse for the RuCn(PF6)2 compounds. Using the approximation of hexagonal close packing, we can translate the area per molecule into the intermolecular distance at the interface (Figure 6a, right). For the RuCn(PF6)2 compounds, it is comparable to the diameter of the ruthenium headgroup (around 10 Å2 estimated by DFT simulations; see Figure 6c and the Supporting Information for calculation details). However, for the RuCn(Cl)2 compounds with odd number of carbons, the diameter per molecule is significantly smaller. We therefore conclude that the RuCn(Cl)2 compounds tend to form a zigzag-type arrangement with respect to the interface-plane, and the RuCn(PF6)2 compounds form a uniform monolayer as drawn in Figure 6d. Another striking difference between the two types of counterions is the value of surface tension when the interface is saturated with surfactants, namely, γcol for the RuCn(PF6)2 compounds and γmin for the RuCn(Cl)2 ones. These values are compared and reported in Figure 6b. Even if these values seem comparable with the carbon chain corresponding to n = 12, the evolution of these parameters with n is intrinsically different; γmin increases with n when γcol decreases with n. This latter behavior can be linked with the hydrophobicity of the molecules that increases when the alkyl chain is longer.
Figure 6.

(a) Area per molecule and (b) minimum surface tension as a function of the length of the alkyl chain n for the two types of counterions. The area per molecule is the value at the collapse Acol for the RuCn(PF6)2 compounds (Table 1) and the excluded area α from the Volmer model for the RuCn(Cl)2 compounds (Table 3). The scale of corresponding intermolecular distance d is shown on the right axis. (b) The minimum surface tension corresponds to the surface tension at the collapse γcol for the RuCn(PF6)2 compounds and to the minimum equilibrium surface tension γmin for the RuCn(Cl)2 compounds. (c) DFT-minimized molecular geometry of RuC172+ in the gas phase showing the dimensions of the ruthenium head. (d) Hypothesized arrangements of the bis-cationic amphiphiles at the air–water interface.
Conclusions
In conclusion, our first-in-kind study on the surfactant properties of the amphiphilic [Ru(bpy)2(Cnbpy)]2+ complexes clearly demonstrates not only that the counterion type plays a major role on their solubility in water but also that it influences their aggregation and their molecular area at the air–water interface and, hence, their interfacial properties: hexafluorophosphate complexes take about 4 times as much area at the interface compared to chloride complexes. This effect suggests different assemblies at the interface, and we hypothesize a form of zigzag staggered arrangement of the chloride compounds, which probably does not take place for the hexafluorophosphate analogues.
Interestingly, the RuCn(PF6)2 series of compounds followed a clear trend: their surfactant properties are predominantly governed by the large contact ion pair formation at the interface and intermolecular van der Waals interactions of the tails. Their ability to lower the surface tension monotonously decreases with increasing alkyl chain length. On the contrary, the more water-soluble RuCn(Cl)2 compounds behave in a more contrasted way. In this series, changing the alkyl chain length of the molecule had a strong influence on its surfactant properties. While the C9 molecules did behave like good surfactants, the C12, C15, and C17 analogues were more hydrophobic (even with chloride anions) and therefore showed poorer surfactant properties; we may even claim that the surfactant properties of RuC17(Cl)2 are negligible. For the C9–C15 surfactants, as they are more compacted at the interface, some more complex interactions determine their properties, which depend not only on the length of the carbon tail but also probably on its conformation. To shed more light on this question, characterizations of RuCn(Cl)2 compounds with more and/or closer n values will be needed. Overall, depending on the targeted properties, a compromise between the surface activity of these amphiphilic ruthenium polypyridyl compounds and their ability to form very dense layers at the interface may be considered. If a good “soapy” surfactant is looked for, then RuCn(Cl)2 should be chosen, while on the contrary if a ruthenium compound that disturbs minimally the water–air interface is preferred, one of the PF6 complexes, or RuC17(Cl)2, should be chosen. Though still limited, notably regarding lower (n = 3–8) or even (n = 10, 14, 16) numbers of carbon atoms in each alkyl chain, these new findings represent an important step toward the preparation and understanding of photocatalytic soft interfaces.
Acknowledgments
This project has received funding from the European Union’s Horizon 2020 research and innovation program FETOPEN 2018–2020 under grant agreement 828838—SoFiA. D.M.K. thanks The Netherlands Organization for Scientific Research (NWO) for an HRSMC PhD fellowship. M.L.M. and A.-L.B. thank E. Benichou and O. Bonhomme for fruitful discussions on Langmuir trough experiments, and Teclis Instruments for funding. Y.T. is grateful to Anaïs Benarouche and Jean-Luc Bridot for useful discussions on experimental protocols.
Supporting Information Available
The Supporting Information is available free of charge at https://pubs.acs.org/doi/10.1021/acs.langmuir.2c01391.
Influence of initial coverage on Langmuir trough results; solubility of RuC17(Cl)2 at various temperatures; dilational viscoelasticity of the surface with RuCn(Cl)2; and geometry optimization of RuC172+ via DFT (PDF)
The authors declare no competing financial interest.
Supplementary Material
References
- Yazdi A. S. Surfactant-Based Extraction Methods. TrAC Trends Anal. Chem. 2011, 30 (6), 918–929. 10.1016/j.trac.2011.02.010. [DOI] [Google Scholar]
- Kralova I.; Sjöblom J. Surfactants Used in Food Industry: A Review. J. Dispers. Sci. Technol. 2009, 30 (9), 1363–1383. 10.1080/01932690902735561. [DOI] [Google Scholar]
- Englert C.; Brendel J. C.; Majdanski T. C.; Yildirim T.; Schubert S.; Gottschaldt M.; Windhab N.; Schubert U. S. Pharmapolymers in the 21st Century: Synthetic Polymers in Drug Delivery Applications. Prog. Polym. Sci. 2018, 87, 107–164. 10.1016/j.progpolymsci.2018.07.005. [DOI] [Google Scholar]
- Binnemans K.; Görller-Walrand C. Lanthanide-Containing Liquid Crystals and Surfactants. Chem. Rev. 2002, 102 (6), 2303–2345. 10.1021/cr010287y. [DOI] [PubMed] [Google Scholar]
- Polarz S.; Odendal J. A.; Hermann S.; Klaiber A. Amphiphilic Hybrids Containing Inorganic Constituent: More than Soap. Curr. Opin. Colloid Interface Sci. 2015, 20 (3), 151–160. 10.1016/j.cocis.2015.07.006. [DOI] [Google Scholar]
- Limburg B.; Wermink J.; Van Nielen S. S.; Kortlever R.; Koper M. T. M.; Bouwman E.; Bonnet S. Kinetics of Photocatalytic Water Oxidation at Liposomes: Membrane Anchoring Stabilizes the Photosensitizer. ACS Catal. 2016, 6 (9), 5968–5977. 10.1021/acscatal.6b00151. [DOI] [Google Scholar]
- Klein D. M.; Rodríguez-Jiménez S.; Hoefnagel M. E.; Pannwitz A.; Prabhakaran A.; Siegler M. A.; Keyes T. E.; Reisner E.; Brouwer A. M.; Bonnet S. Shorter Alkyl Chains Enhance Molecular Diffusion and Electron Transfer Kinetics between Photosensitisers and Catalysts in CO 2 -Reducing Photocatalytic Liposomes. Chem. - A Eur. J. 2021, 27 (68), 17203–17212. 10.1002/chem.202102989. [DOI] [PMC free article] [PubMed] [Google Scholar]
- Pannwitz A.; Klein D. M.; Rodríguez-Jiménez S.; Casadevall C.; Song H.; Reisner E.; Hammarström L.; Bonnet S. Roadmap towards Solar Fuel Synthesis at the Water Interface of Liposome Membranes. Chem. Soc. Rev. 2021, 50 (8), 4833–4855. 10.1039/D0CS00737D. [DOI] [PubMed] [Google Scholar]
- Becker R.; Bouwens T.; Schippers E. C. F.; van Gelderen T.; Hilbers M.; Woutersen S.; Reek J. N. H. Photocatalytic Hydrogen Generation by Vesicle-Embedded [FeFe]Hydrogenase Mimics: A Mechanistic Study. Chem. - A Eur. J. 2019, 25 (61), 13921–13929. 10.1002/chem.201902514. [DOI] [PMC free article] [PubMed] [Google Scholar]
- Hansen M.; Troppmann S.; König B. Artificial Photosynthesis at Dynamic Self-Assembled Interfaces in Water. Chem. - A Eur. J. 2016, 22 (1), 58–72. 10.1002/chem.201503712. [DOI] [PubMed] [Google Scholar]
- Troppmann S.; König B. Functionalized Membranes for Photocatalytic Hydrogen Production. Chem. - A Eur. J. 2014, 20 (45), 14570–14574. 10.1002/chem.201404480. [DOI] [PubMed] [Google Scholar]
- Ikuta N.; Takizawa S.; Murata S. Photochemical Reduction of CO 2 with Ascorbate in Aqueous Solution Using Vesicles Acting as Photocatalysts. Photochem. Photobiol. Sci. 2014, 13 (4), 691–702. 10.1039/C3PP50429H. [DOI] [PubMed] [Google Scholar]
- Falciani G.; Franklin R.; Cagna A.; Sen I.; Hassanali A.; Chiavazzo E. A Multi-Scale Perspective of Gas Transport through Soap-Film Membranes. Mol. Syst. Des. Eng. 2020, 5 (5), 911–921. 10.1039/C9ME00186G. [DOI] [Google Scholar]
- Limburg B.; Bouwman E.; Bonnet S. Catalytic Photoinduced Electron Transport across a Lipid Bilayer Mediated by a Membrane-Soluble Electron Relay. Chem. Commun. 2015, 51 (96), 17128–17131. 10.1039/C5CC07745A. [DOI] [PubMed] [Google Scholar]
- Limburg B.; Hilbers M.; Brouwer A. M.; Bouwman E.; Bonnet S. The Effect of Liposomes on the Kinetics and Mechanism of the Photocatalytic Reduction of 5,5′-Dithiobis(2-Nitrobenzoic Acid) by Triethanolamine. J. Phys. Chem. B 2016, 120 (50), 12850–12862. 10.1021/acs.jpcb.6b09635. [DOI] [PubMed] [Google Scholar]
- Robinson J. N.; Cole-Hamilton D. J. Electron Transfer across Vesicle Bilayers. Chem. Soc. Rev. 1991, 20 (1), 49–94. 10.1039/cs9912000049. [DOI] [Google Scholar]
- Arias-Rotondo D. M.; McCusker J. K. The Photophysics of Photoredox Catalysis: A Roadmap for Catalyst Design. Chem. Soc. Rev. 2016, 45 (21), 5803–5820. 10.1039/C6CS00526H. [DOI] [PubMed] [Google Scholar]
- Rosen M. J. The Relationship of Structure to Properties in Surfactants. IV. Effectiveness in Surface or Interfacial Tension Reduction. J. Colloid Interface Sci. 1976, 56 (2), 320–327. 10.1016/0021-9797(76)90257-5. [DOI] [Google Scholar]
- Rosen M. J. Relationship of Structure to Properties in Surfactants: II. Efficiency in Surface or Interfacial Tension Reduction. J. Am. Oil Chem. Soc. 1974, 51 (10), 461–465. 10.1007/BF02635155. [DOI] [Google Scholar]
- Benjamins J.; Cagna A.; Lucassen-Reynders E. H. Viscoelastic Properties of Triacylglycerol/Water Interfaces Covered by Proteins. Colloids Surfaces A Physicochem. Eng. Asp. 1996, 114, 245–254. 10.1016/0927-7757(96)03533-9. [DOI] [Google Scholar]
- Cambridge Crystal Structure Database. https://www.ccdc.cam.ac.uk/structures/.
- MacRae C. F.; Sovago I.; Cottrell S. J.; Galek P. T. A.; McCabe P.; Pidcock E.; Platings M.; Shields G. P.; Stevens J. S.; Towler M.; Wood P. A. Mercury 4.0: From Visualization to Analysis, Design and Prediction. J. Appl. Cryst. 2020, 53 (1), 226–235. 10.1107/S1600576719014092. [DOI] [PMC free article] [PubMed] [Google Scholar]
- Neuthe K.; Bittner F.; Stiemke F.; Ziem B.; Du J.; Zellner M.; Wark M.; Schubert T.; Haag R. Phosphonic Acid Anchored Ruthenium Complexes for ZnO-Based Dye-Sensitized Solar Cells. Dye. Pigment. 2014, 104, 24–33. 10.1016/j.dyepig.2013.12.018. [DOI] [Google Scholar]
- Knobler C. M.Recent Developments in the Study of Monolayers at the Air-Water Interface. In Advances in Chemical Physics; John Wiley & Sons, Ltd, 1990; pp 397–449. 10.1002/9780470141267.ch7. [DOI] [Google Scholar]
- Lee K. Y. C. Collapse Mechanisms of Langmuir Monolayers. Annu. Rev. Phys. Chem. 2008, 59 (1), 771–791. 10.1146/annurev.physchem.58.032806.104619. [DOI] [PubMed] [Google Scholar]
- Knobler C. M. Seeing Phenomena in Flatland: Studies of Monolayers by Fluorescence Microscopy. Science 1990, 249 (4971), 870–874. 10.1126/science.249.4971.870. [DOI] [PubMed] [Google Scholar]
- Kaganer V. M.; Möhwald H.; Dutta P. Structure and Phase Transitions in Langmuir Monolayers. Rev. Mod. Phys. 1999, 71 (3), 779. 10.1103/RevModPhys.71.779. [DOI] [Google Scholar]
- Fainerman V. B.; Miller R.; Kovalchuk V. I. Influence of the Compressibility of Adsorbed Layers on the Surface Dilational Elasticity. Langmuir 2002, 18 (20), 7748–7752. 10.1021/la020024e. [DOI] [Google Scholar]
- Fainerman V. B.; Miller R.; Kovalchuk V. I. Influence of the Two-Dimensional Compressibility on the Surface Pressure Isotherm and Dilational Elasticity of Dodecyldimethylphosphine Oxide. J. Phys. Chem. B 2003, 107 (25), 6119–6121. 10.1021/jp021876q. [DOI] [Google Scholar]
- Pradines V.; Krägel J.; Fainerman V. B.; Miller R. Interfacial Properties of Mixed β-Lactoglobulin-SDS Layers at the Water/Air and Water/Oil Interface. J. Phys. Chem. B 2009, 113 (3), 745–751. 10.1021/jp8091573. [DOI] [PubMed] [Google Scholar]
- He Y.; Yazhgur P.; Salonen A.; Langevin D. Adsorption-Desorption Kinetics of Surfactants at Liquid Surfaces. Adv. Colloid Interface Sci. 2015, 222, 377–384. 10.1016/j.cis.2014.09.002. [DOI] [PubMed] [Google Scholar]
- Eastoe J.; Dalton J. S. Dynamic Surface Tension and Adsorption Mechanisms of Surfactants at the Air-Water Interface. Adv. Colloid Interface Sci. 2000, 85 (2–3), 103–144. 10.1016/S0001-8686(99)00017-2. [DOI] [PubMed] [Google Scholar]
- Ward A. F. H.; Tordai L. Time-Dependence of Boundary Tensions of Solutions I. The Role of Diffusion in Time-Effects. J. Chem. Phys. 1946, 14 (7), 453–461. 10.1063/1.1724167. [DOI] [Google Scholar]
- Fainerman V. B.; Makievski A. V.; Miller R. The Analysis of Dynamic Surface Tension of Sodium Alkyl Sulphate Solutions, Based on Asymptotic Equations of Adsorption Kinetic Theory. Colloids Surfaces A Physicochem. Eng. Asp. 1994, 87 (1), 61–75. 10.1016/0927-7757(94)02747-1. [DOI] [Google Scholar]
- Einstein A. Über Die von Der Molekularkinetischen Theorie Der Wärme Geforderte Bewegung von in Ruhenden Flüssigkeiten Suspendierten Teilchen. Ann. Phys. 1905, 322 (8), 549–560. 10.1002/andp.19053220806. [DOI] [Google Scholar]
- Lin S. -Y; McKeigue K.; Maldarelli C. Diffusion-Controlled Surfactant Adsorption Studied by Pendant Drop Digitization. AIChE J. 1990, 36 (12), 1785–1795. 10.1002/aic.690361202. [DOI] [Google Scholar]
- Phan C. M.; Le T. N.; Nguyen C. V.; Yusa S. I. Modeling Adsorption of Cationic Surfactants at Air/Water Interface without Using the Gibbs Equation. Langmuir 2013, 29 (15), 4743–4749. 10.1021/la3046302. [DOI] [PubMed] [Google Scholar]
- Stubenrauch C.; Fainerman V. B.; Aksenenko E. V.; Miller R. Adsorption Behavior and Dilational Rheology of the Cationic Alkyl Trimethylammonium Bromides at the Water/Air Interface. J. Phys. Chem. B 2005, 109 (4), 1505–1509. 10.1021/jp046525l. [DOI] [PubMed] [Google Scholar]
- Geeraerts G.; Joos P.; Villé F. Dynamic Surface Tensions and Dynamic Surface Potentials of Aqueous Solutions of a Cationic Surface Active Electrolyte. Colloids Surfaces A Physicochem. Eng. Asp. 1995, 95 (2–3), 281–291. 10.1016/0927-7757(94)03024-T. [DOI] [Google Scholar]
- Rosen M. J.; Kunjappu J. T.. Surfactants Interfacial Phenom, 4th ed.; John Wiley & Sons, 2012. 10.1002/9781118228920. [DOI] [Google Scholar]
- Bergeron V. Disjoining Pressures and Film Stability of Alkyltrimethylammonium Bromide Foam Films. Langmuir 1997, 13 (13), 3474–3482. 10.1021/la970004q. [DOI] [Google Scholar]
- Varga I.; Mészáros R.; Gilányi T. Adsorption of Sodium Alkyl Sulfate Homologues at the Air/Solution Interface. J. Phys. Chem. B 2007, 111 (25), 7160–7168. 10.1021/jp071344f. [DOI] [PubMed] [Google Scholar]
- Chen L. J.; Lin S. Y.; Huang C. C. Effect of Hydrophobic Chain Length of Surfactants on Enthalpy-Entropy Compensation of Micellization. J. Phys. Chem. B 1998, 102 (22), 4350–4356. 10.1021/jp9804345. [DOI] [Google Scholar]
- Mantha S.; McDaniel J. G.; Perroni D. V.; Mahanthappa M. K.; Yethiraj A. Electrostatic Interactions Govern “Odd/Even” Effects in Water-Induced Gemini Surfactant Self-Assembly. J. Phys. Chem. B 2017, 121 (3), 565–576. 10.1021/acs.jpcb.6b06882. [DOI] [PubMed] [Google Scholar]
- Auger N.; Touchard D.; Rigaut S.; Halet J. F.; Saillard J. Y. Electronic Structure of Ruthenium Cumulene Complexes [Cl(PH3)4RuCnH2]+ (n = 1–8) and of Their Reduced States. Bonding and Properties of the Cationic, Neutral, and Anionic Series with Respect to the Cumulenic Chain Length. Organometallics 2003, 22 (8), 1638–1644. 10.1021/om020543c. [DOI] [Google Scholar]
- Koshy L.; Pegiadou-Koemtjopoulou S.; Rakshit A. K. Thermodynamics of Micellization of Some New Pyrimidinium Cationic Surfactants. Colloids Surf. 1991, 59 (C), 1–6. 10.1016/0166-6622(91)80232-D. [DOI] [Google Scholar]
- Volmer M. Thermodynamische Folgerungen Aus Der Zustandsgleichung Für Adsorbierte Stoffe. Zeitschrift für Phys. Chemie 1925, 115U (1), 253–260. 10.1515/zpch-1925-11519. [DOI] [Google Scholar]
- Puttreddy R.; Hutchison J. A.; Gorodetski Y.; Harrowfield J.; Rissanen K. Enantiomer Separation of Tris(2,2′-Bipyridine)Ruthenium(II): Interaction of a D 3 -Symmetric Cation with a C 2 -Symmetric Anion. Cryst. Growth Des. 2015, 15 (4), 1559–1563. 10.1021/acs.cgd.5b00053. [DOI] [Google Scholar]
Associated Data
This section collects any data citations, data availability statements, or supplementary materials included in this article.