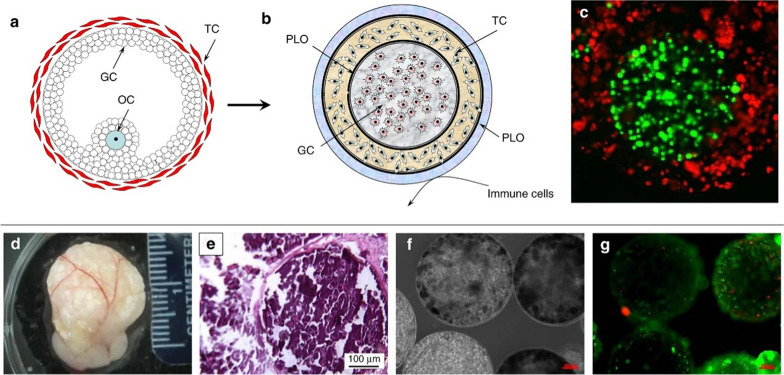
Fig. 8.
Schematic diagram of a native ovarian follicle (a) compared to the bioengineered ovarian construct (b). 3D-confocal images of bioengineered ovarian construct (c) demonstrating compartmentalization of different cells within the constructs as determined through the use of CellTracker green-labeled cells (granulosa) in the inner layer and CellTracker orange-labeled cells (theca) in the outer layer. Images of bioengineered ovarian construct retrieved 90 days after transplantation into ovariectomized rats including the presence of the vascularized omentum pouch enclosing the constructs following explantation (d). Explanted constructs showed minimal fibrous encapsulation as indicated by H&E staining (e). Phase-contrast images of the microcapsules after retrieval show that the constructs remain intact throughout the 90-day period tested in vivo (f). Live/dead imaging of the retrieved capsules (g), where green indicates live and red indicates dead cells, which shows that most cells in the constructs remained viable during the 90-day implantation period. Scale bars are 100 μm for e–g (the figure is reproduced from Sittadjody et al. [274] with required copyright permission)

