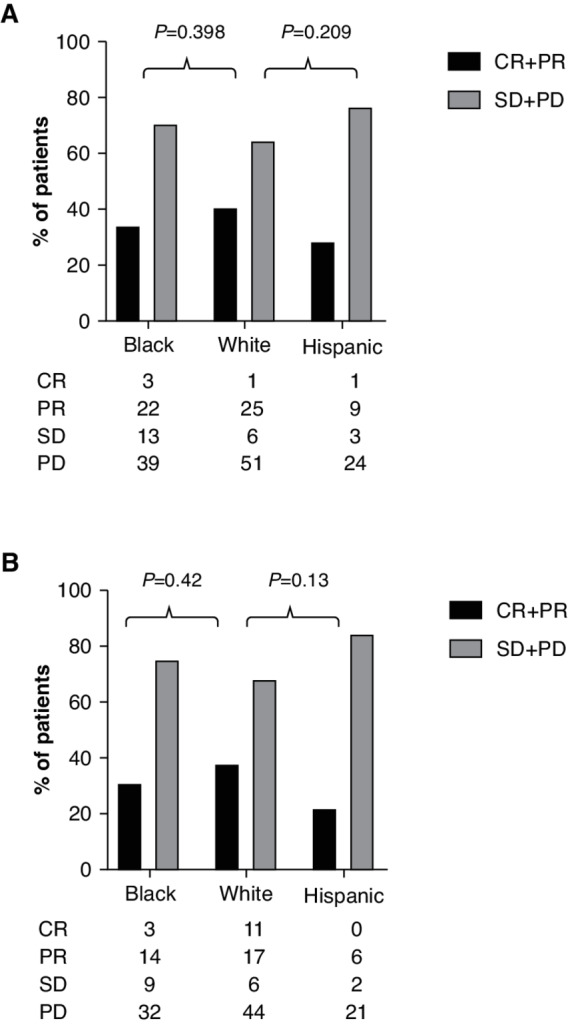
FIGURE 2.

Best overall response by race/ethnic group. A, ORR data for all patients and by race/ethnic group for patients treated with either ICI monotherapy or chemo/ICI combination therapy. B, ORR data for all patients and by race/ethnic group for patients treated with ICI monotherapy. PR, partial response; SD, stable disease; PD, progressive disease.
