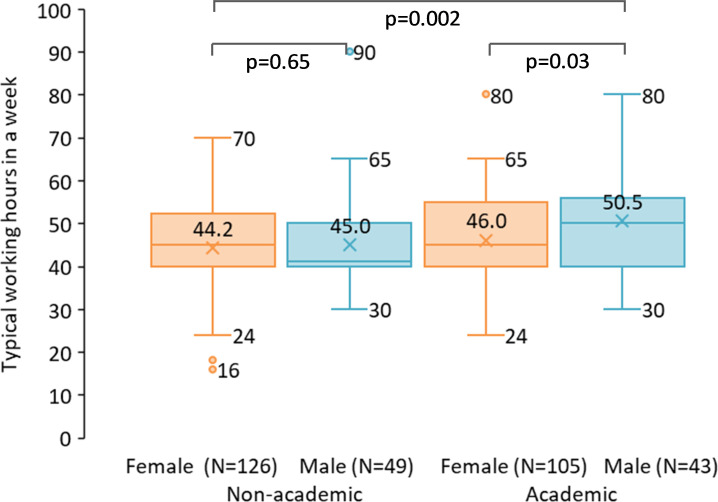
Figure 2.
Typical self-reported working hours in a week by role and gender, EULAR and EMEUNET members, 323 responses. The box and whisker chart shows distribution of data into quartiles: the top of the boxes indicates the upper quartile, the bottom of the boxes indicates the lower quartile, the lines extending vertically indicate variability outside the upper and lower quartiles, the dots outside those lines indicate outliers, the Xs inside the boxes indicate the mean values and the horizontal lines inside the boxes indicate the median values. EMEUNET, Emerging EULAR Network.

