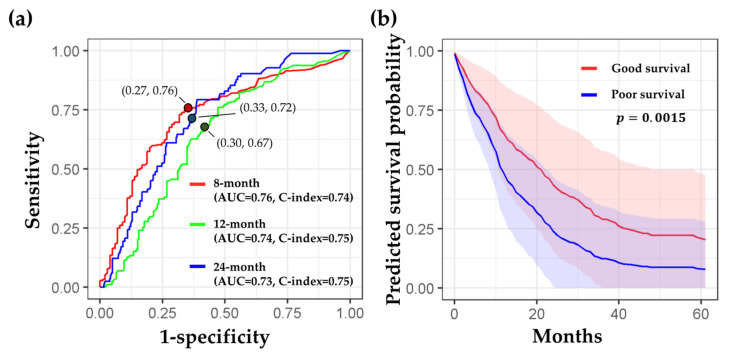
Figure 4.
Detailed performance of the combined model (radiomic + clinical features). (a) Time-dependent ROC curves at 8, 12, and 24 months. Red, green, and blue lines correspond to ROC curves while predicting patients’ survival duration longer than 8, 12, and 24 months, respectively. The red, green, and blue dots are located with the values of “1-specificity” and “sensitivity,” which were estimated with the three optimal probability thresholds (0.65, 0.51, and 0.35) at 8, 12, and 24 months, respectively. (b) The mean survival curves from the good (red) and poor (blue) survival groups were displayed. The significance of the predicted survival probability between the two groups was assessed using a log-rank test.

