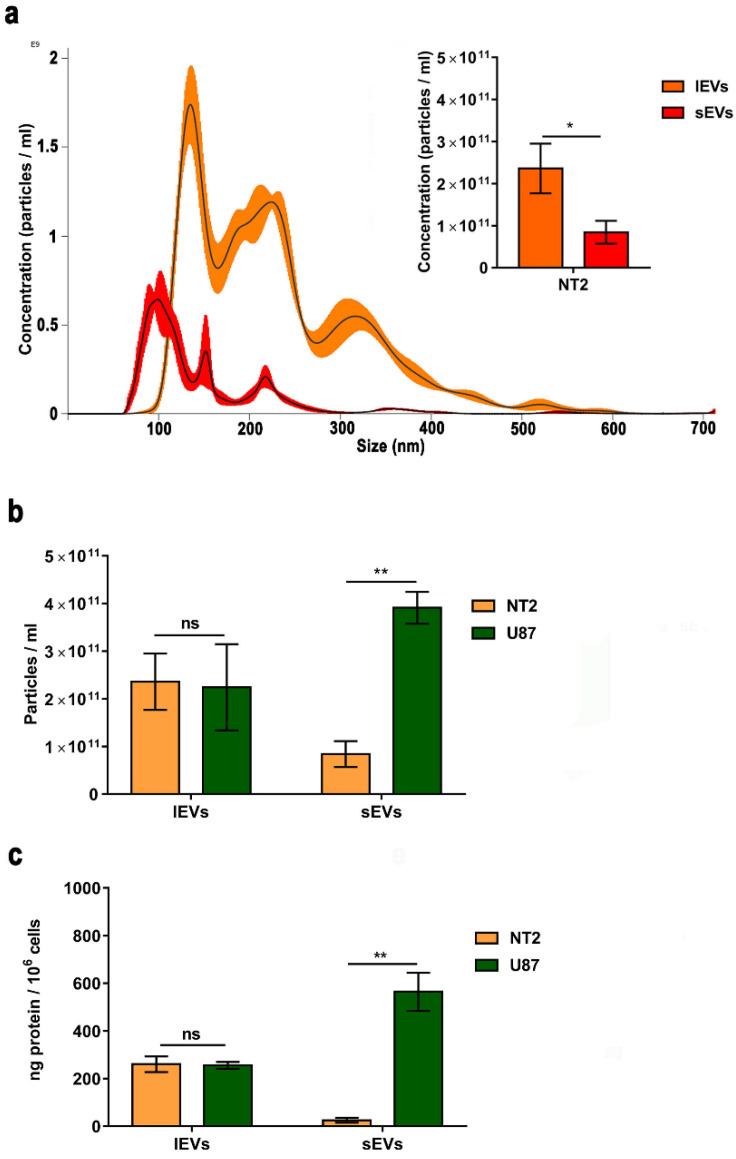
Figure 3.
Extracellular vesicle quantification. (a) Nanoparticle tracking analysis (NTA) of NTERA2 extracellular vesicles. Representative image of size distribution of small extracellular vesicles or sEVs (red line) and large extracellular vesicles or lEVs (orange line). The inset histogram shows the mean ± standard mean error of sEV and lEV concentration. (b,c) Comparison of the concentration of particles measured by NTA (b) and the protein yield (c) in sEV and lEV samples isolated from NTERA2 and U87 cancer cells. The volume of resuspension is kept constant. To determine particle concentration, five and two different samples have been analyzed for NTERA2 and U87, respectively. For each sample, five experiment videos of 60 s duration were analyzed. To determine protein yield six and three different experiments have been analyzed for NTERA2 and U87, respectively. ns not significant, * p < 0.05; ** p< 0.01.

