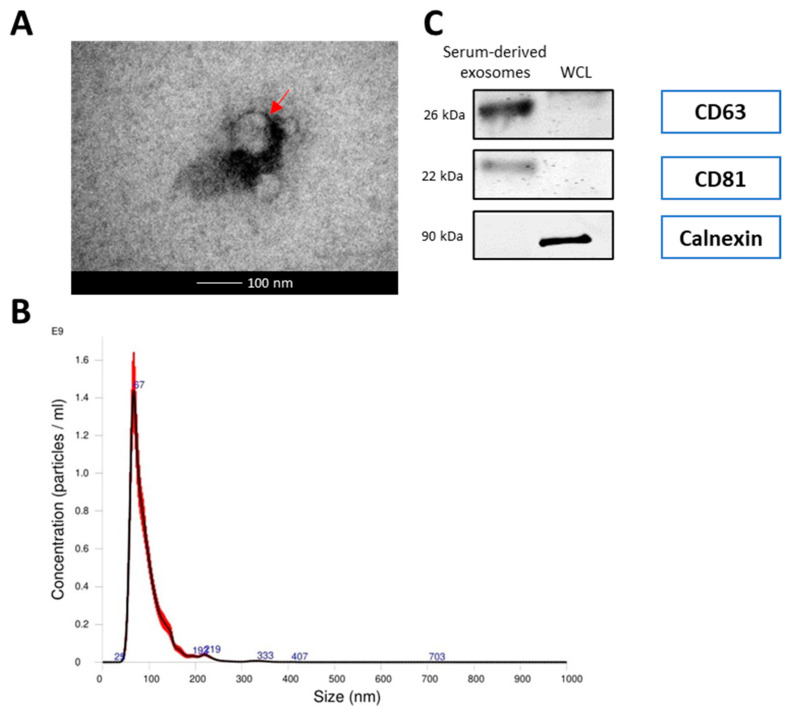
Figure 1.
Characterization of serum exosomes (A) Transmission electron microscope (TEM) images of exosomes isolated from serum. The bar represents 100 nm. Red arrows indicate exosomes. (B) The size distribution of serum exosomes determined by nanoparticle tracking analysis (NTA). (C) Western blot analysis of exosome markers (CD63 and CD81) and negative markers (calnexin) in equivalent amounts of protein from serum exosomes and A549 whole cell lysates (WCL) (as a control). (Original whole Western-blot Images and densitometry reading in Figure 1 and Table S2).

