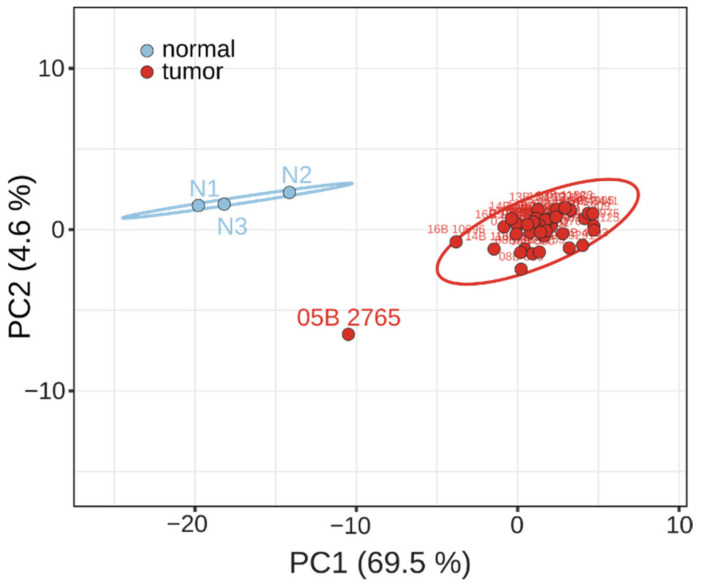
Figure 3.
PCA analysis of RNA expression. Dots indicate OSCA tissue samples (red) and normal ovary tissue samples (blu). X and Y axis show principal component 1 (PC1) and principal component 2 (PC2), which explain 69.5% and 4.6% of the total variance, respectively. Ellipses indicate that a new sample from the same tissue type will fall inside the ellipse with a probability 0.95.

