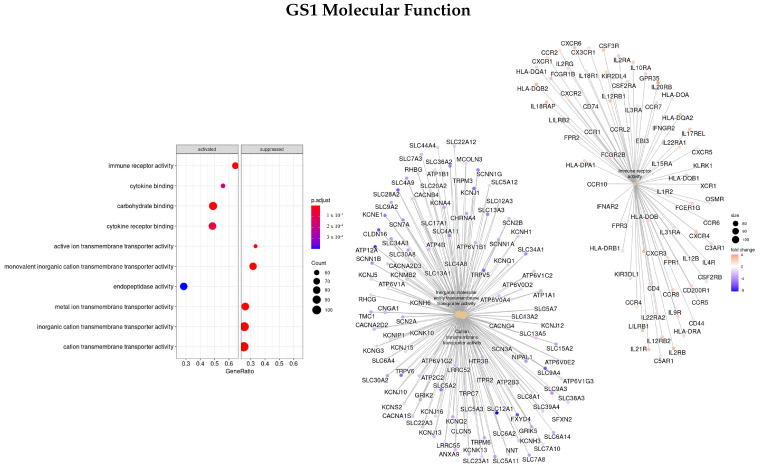
Figure 2.
Gene ontology enrichment analysis regarding molecular function terms for a list of DEGs ranked by the log fold change between tumor and normal tissues. The left panel shows a dot chart with the most significant MF terms. The right panel shows a gene-concept network plot of the three most enriched terms that depicts the linkages of genes and biological concepts as a network.

