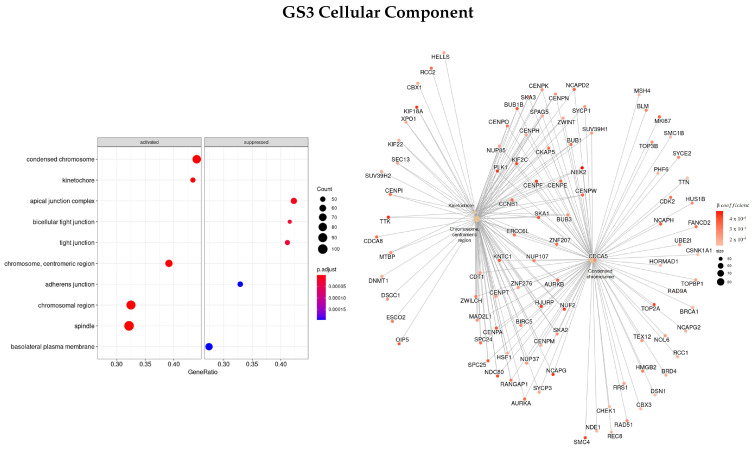
Figure 9.
Gene ontology enrichment analysis regarding cellular components terms for a list of genes selected by EN ranked by the coefficients of the regression. The left panel shows a dot chart with the most significant CC terms and on the right a gene-concept network plot of the three most enriched terms depicts the linkages of genes and biological concepts as a network.

